Data Collection
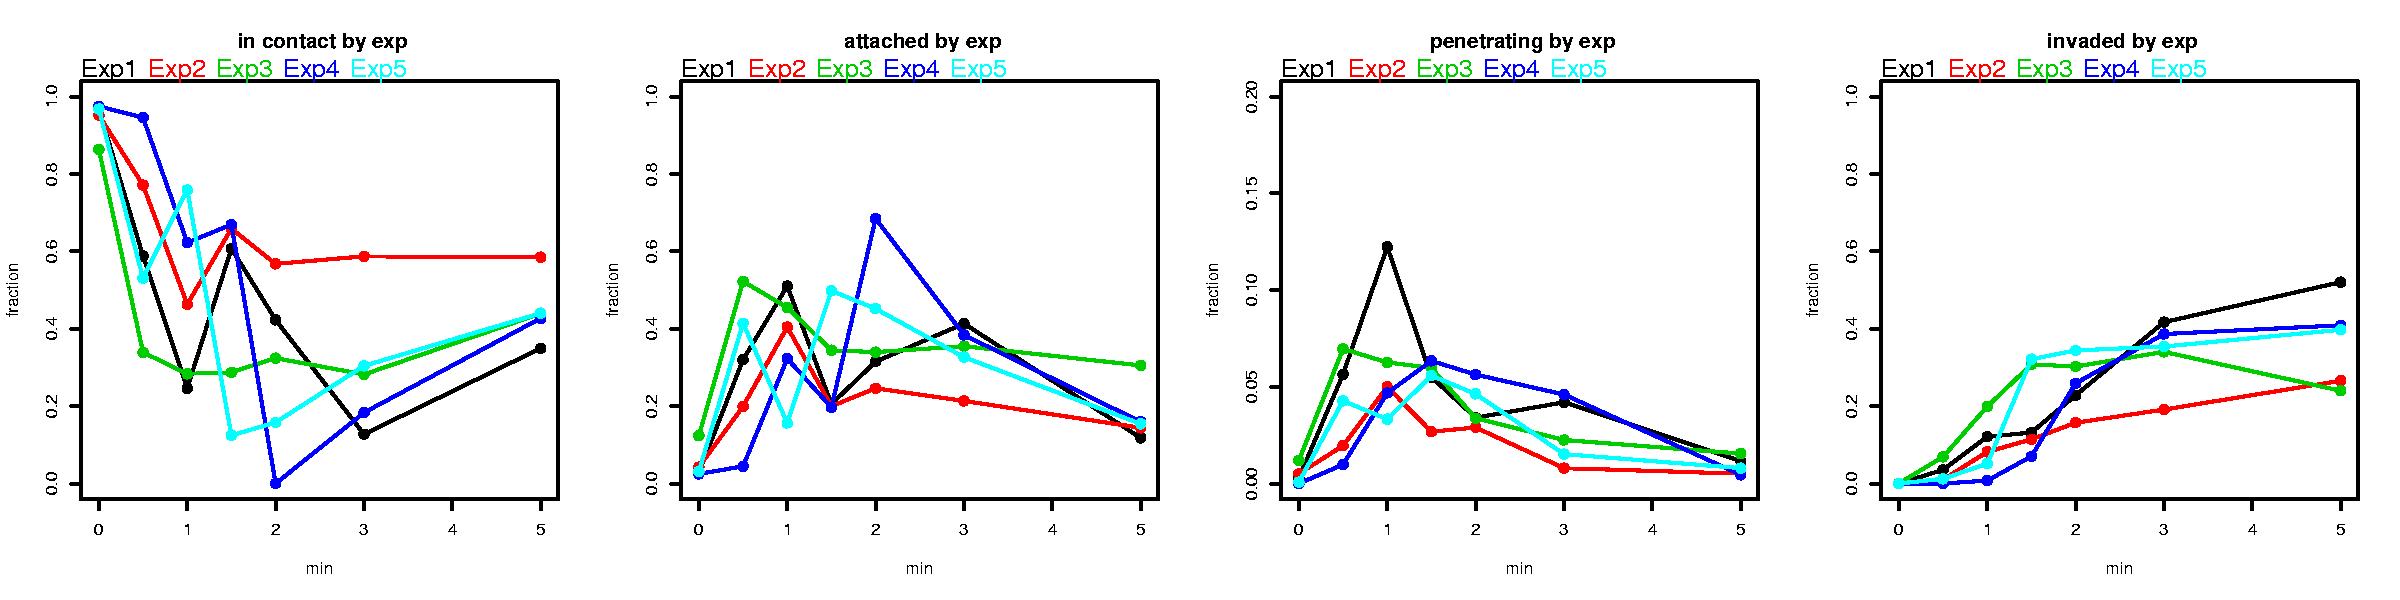
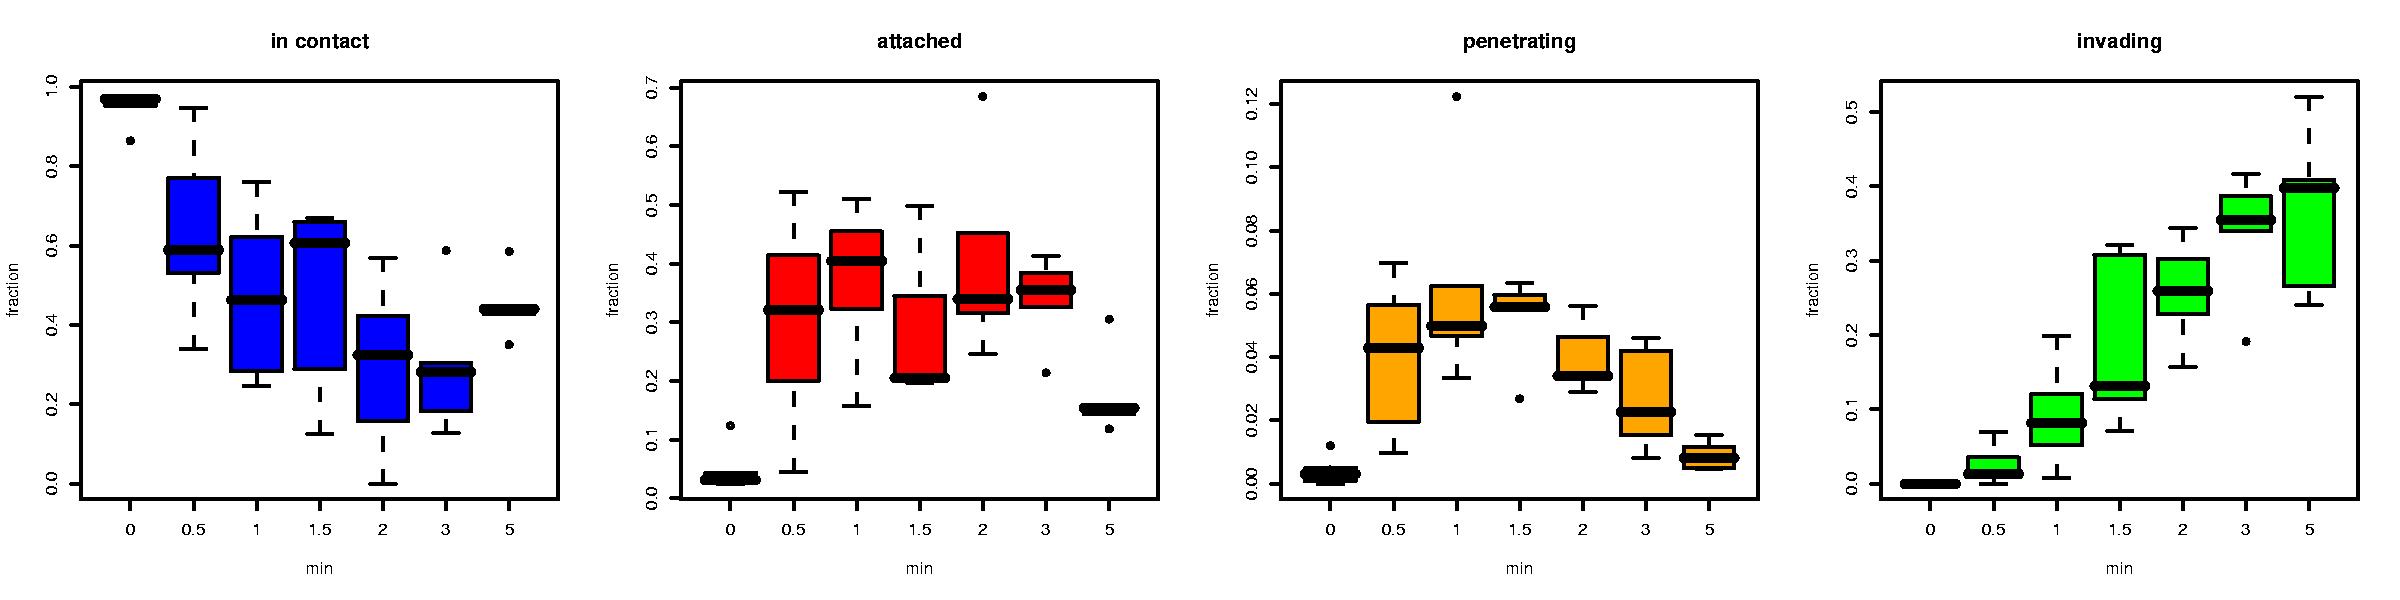
We performed 5 replicates of the experiment.
For each of 7 timepoints we collected images of 9 evenly distributed viewfields for a total of 315 images. For each viewfield image we counted attached (red), penetrating (part red, part green) and invaded parasites using a superimposed grid to improve accuracy. Additionally we counted the number of parasites removed during the buffer switch (see Synchronous Invasion) using a hemocytometer.
We stored all of these counts in an Excel spreadsheet and imported the data into R in Tab-delimited format using read.table().
The data is then summed across the 9 viewfields and the fraction in each compartment is calculated. The sum of the two unobserved states is determined by subtracting the observed counts from the total number of added parasites.
Toxoplasma Invasion Kinetics by State
Toxoplasma Invasion Kinetics by Experiment