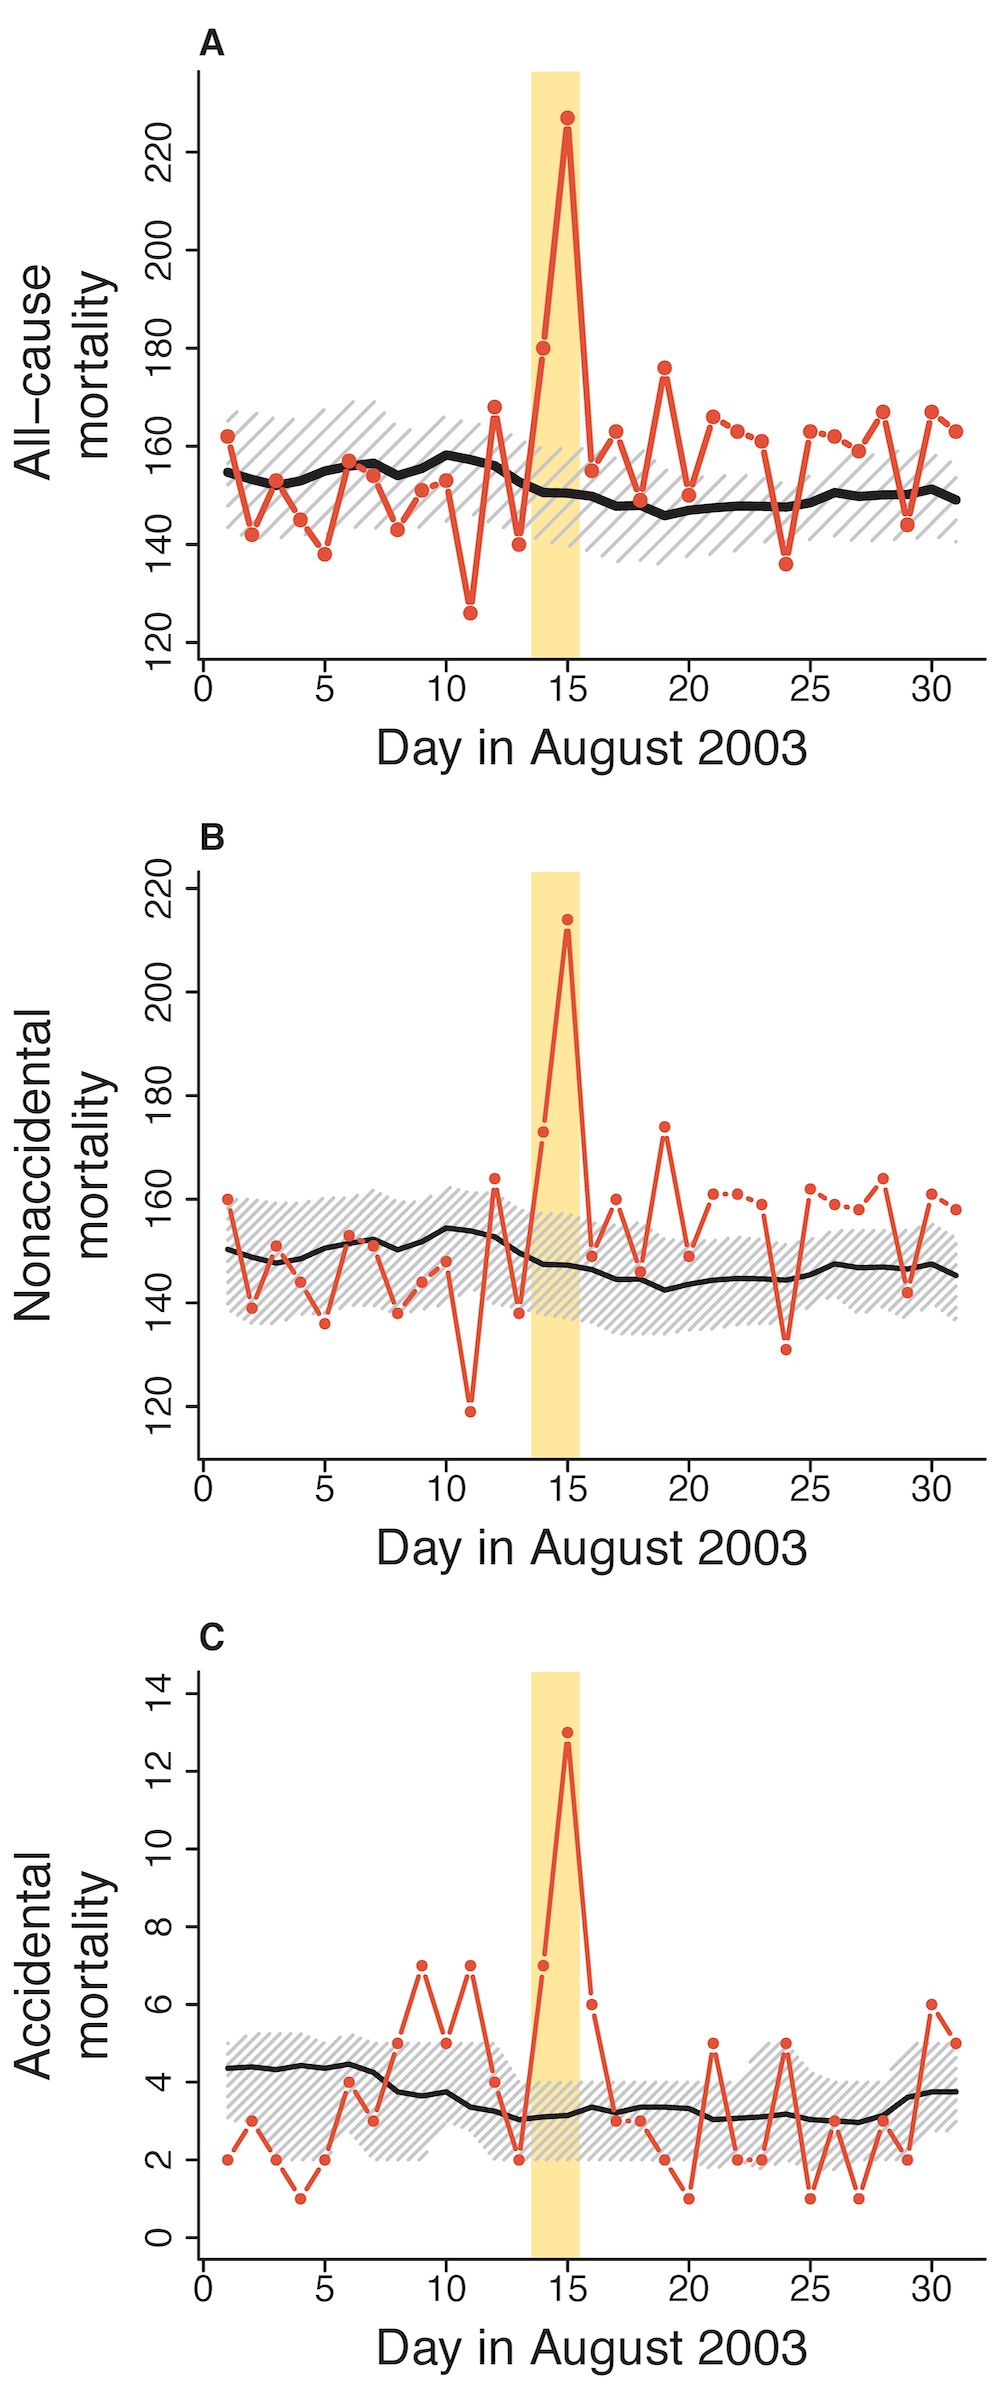
Mortality in New York, NY, during the 2003 Northeastern Blackout for (A) all causes of death; (B) non-accidental causes; and (C) accidental causes. The days of the blackout are highlighted in yellow. The dark black line shows an estimate of expected baseline mortality, based on a two-week running average of the day of year for the two previous and following years. The hatched area shows an estimated range of baseline mortality. The red line shows actual mortality counts during August 2003.