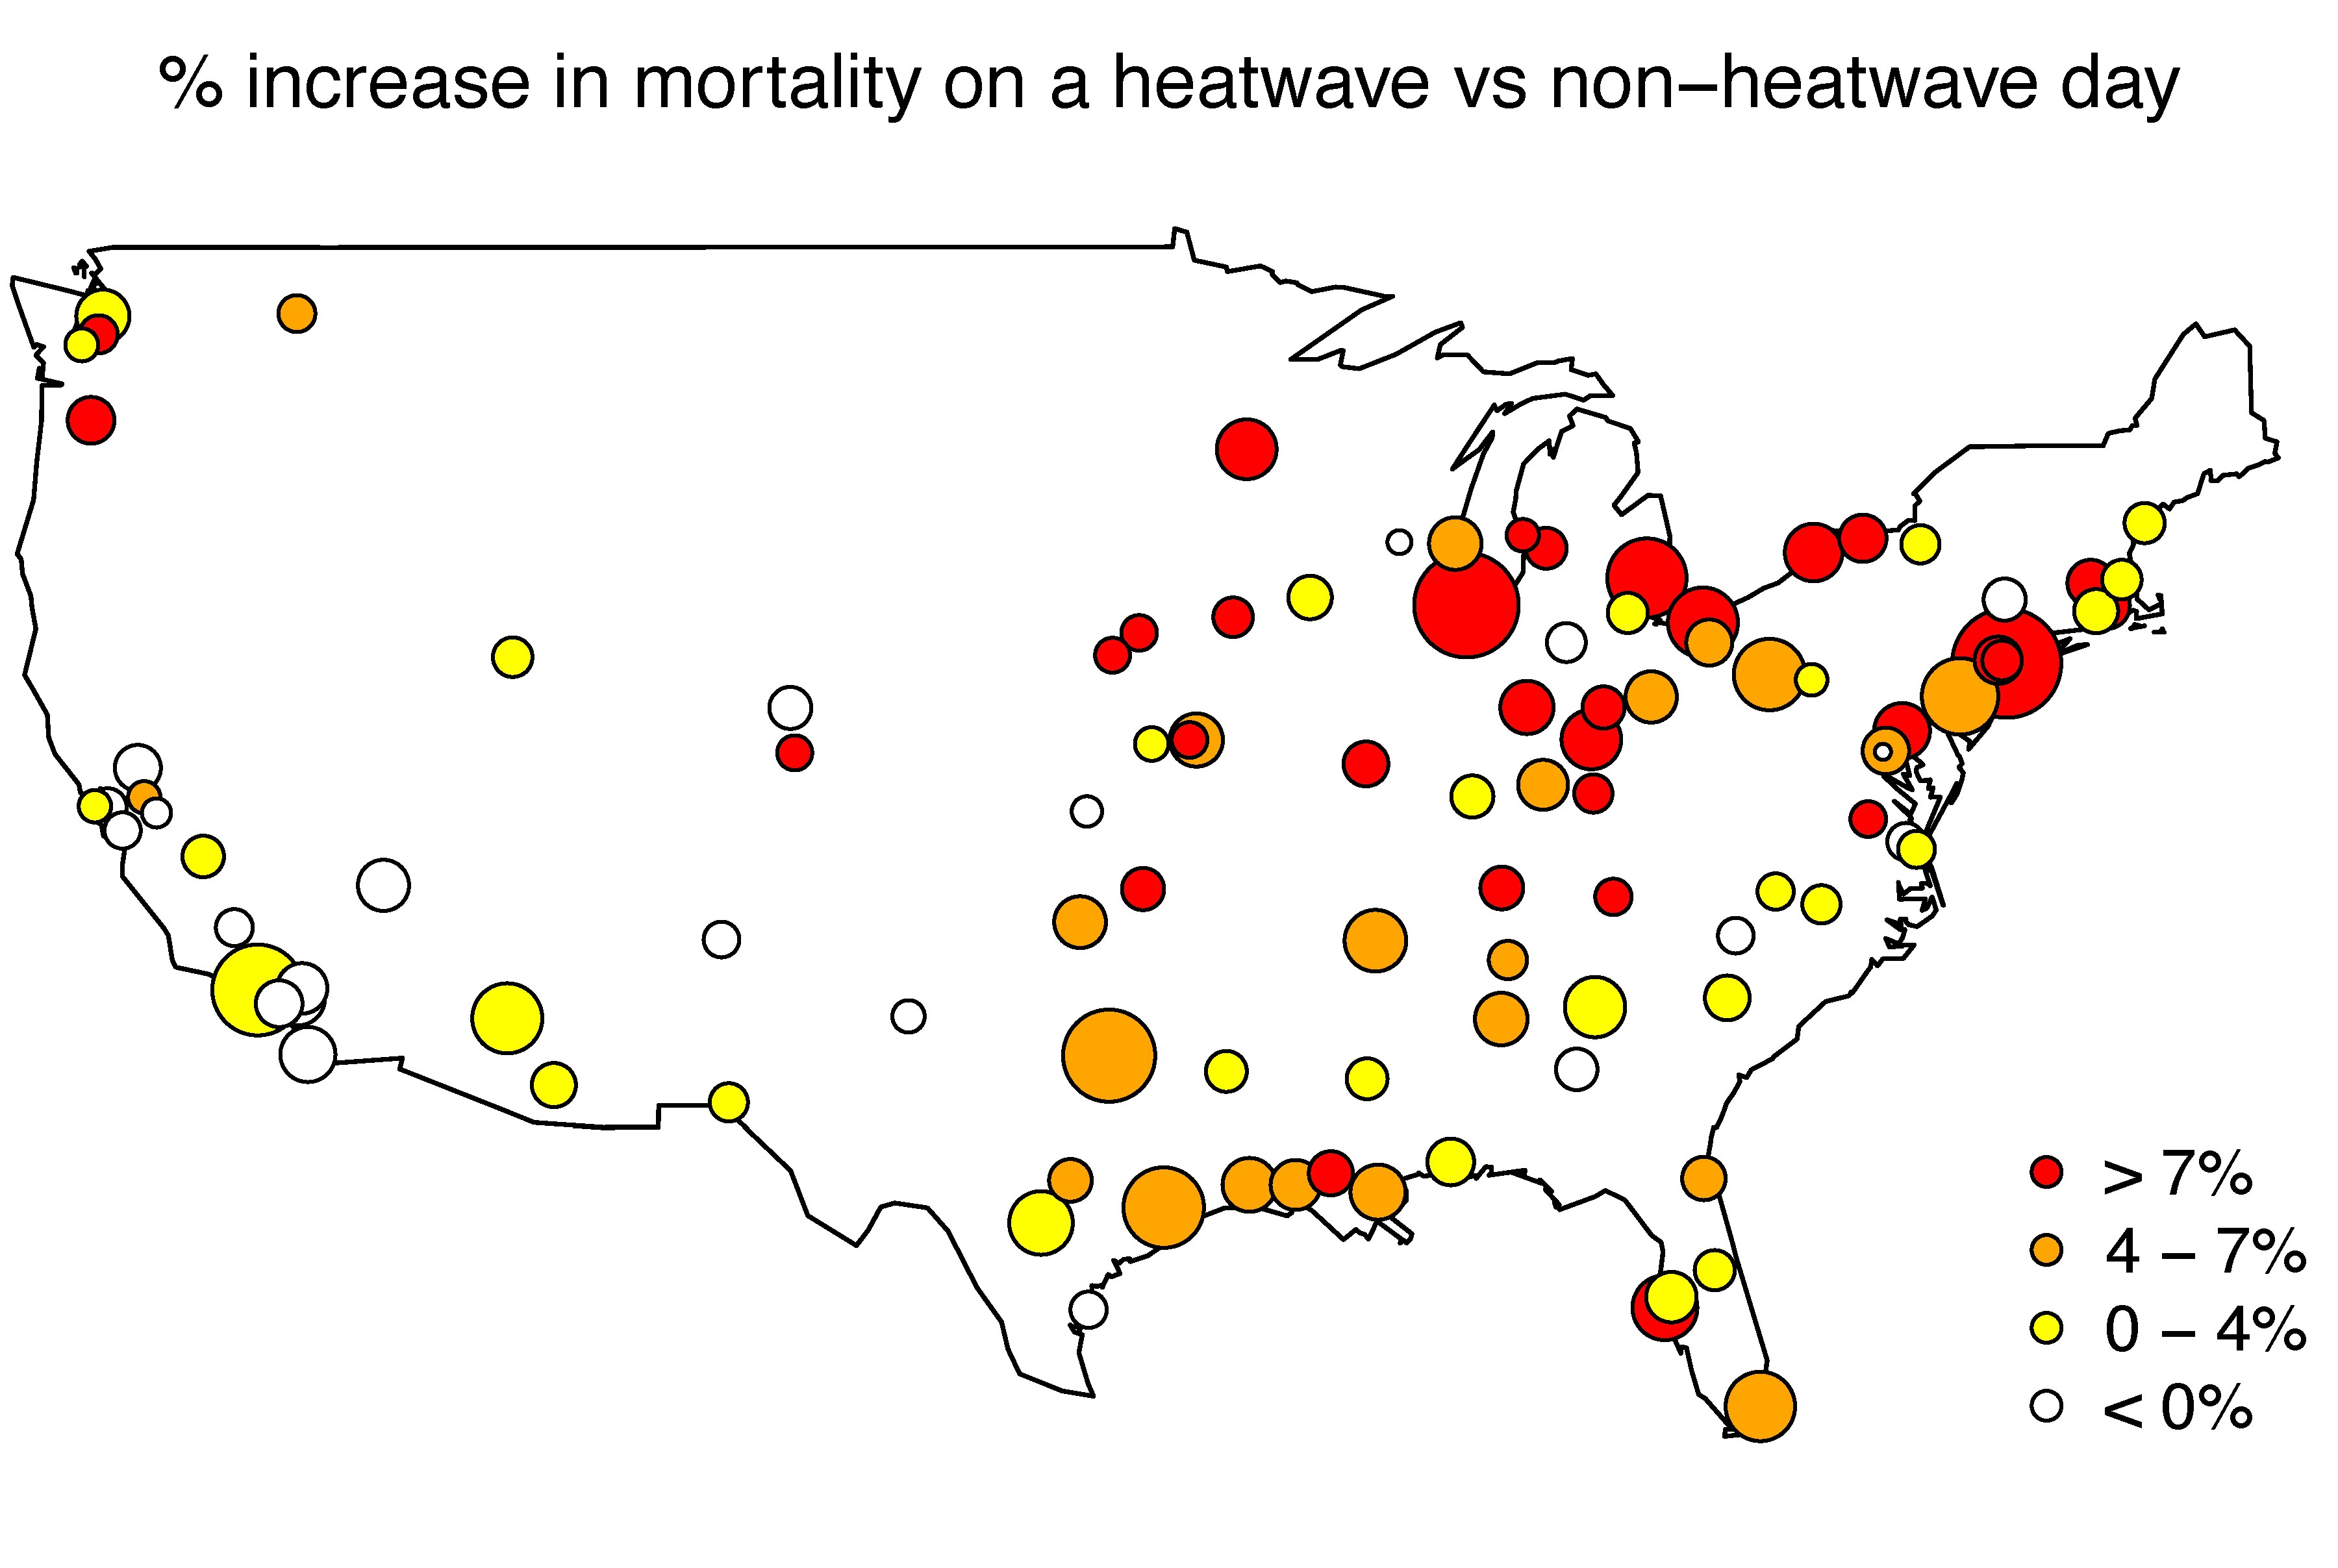
The percent increase in cardiorespiratory mortality during a heat wave in cities across the United States. These estimates are from a study of the impacts of heat, cold, and heat waves on mortality in 109 US communities between 1987 and 2000. The color of each circle shows the estimated effects of a heat wave. These added heat wave risks quantify the risk of a string of hot days and are in addition to the estimated risk of a single day of hot temperature. The size of each circle indicates the certainty of the community-level estimate, with larger circles indicating greater certainty.