Tools
This tools package provides a means by which to submit a
collection of hairpins for BLAST analysis, parse the resulting reports,
and create meaningful graphical interpretations. To
ensure scalability and robustness, the tools have been implemented in a
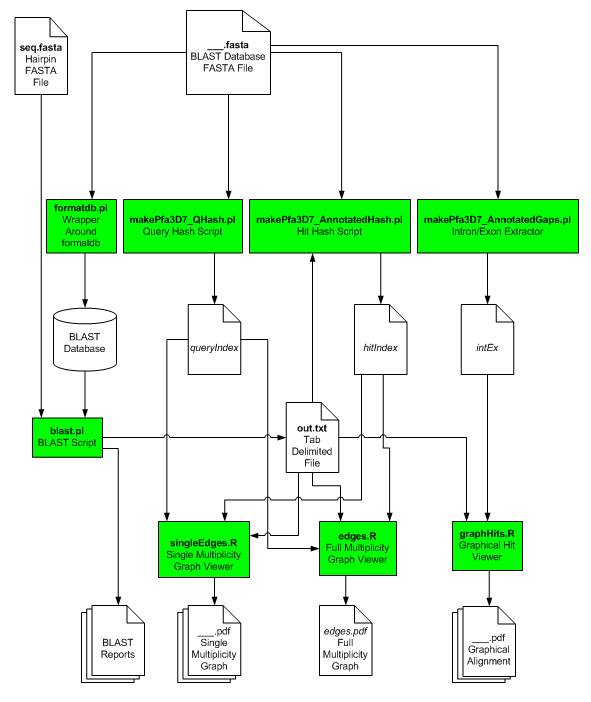
collection of five Perl scripts and three R scripts. The scripts are highlighted in green in the figure below.
The processing pipeline is shown in figure 1. The first script to
be run is the formatdb.pl script. This script is a wrapper around
the formatdb program, used to create local BLAST-able databases, that
comes from NCBI, and is used to create proper accession numbers for the
target proteins before the database is created. Candidate hairpin
sequences, along with the BLAST-able database are then passed to the
blast.pl script. This script then outputs an individual report
file for each hairpin. These BLAST reports are parsed by the
script and the following information is saved to the out.txt file 1)
our query accession numbers, 2) target accession numbers, 3)
coordinates of the beginning of the match in the query, 4) coordinates
of the end of the match in the query, 5) coordinates of the beginning
of the match in the target, 6) coordinates of the end of the match in
the target and 7) the E-value of the match. The
makePfa3D7_AnnotatedHash.pl script uses this file as well as the FASTA
file format of the BLAST database to create an index of the target
accession numbers and their respective chromosome numbers, which is
then stored in the hitIndex file. The makePfa3D7_QHash.pl script
uses the database FASTA file as well and creates an index of the query
sequences and their chromosome numbers. This information is
stored in the queryIndex file. The final Perl script,
makePfa3D7_AnnotatedGaps.pl, again uses the database FASTA file to
create a list of the intron/exon boundaries in the target sequences,
which are stored in the header line of each FASTA entry. These
results are then stored in the intEx file.
After the four text files (out.txt, hitIndex, queryIndex, intEx) have been created, any one of the three R
scripts may be run. The BLAST alignment viewer, graphHits.R uses
the out.txt and intEx files to create graphical representations of the
BLAST results. Inputs from out.txt, queryIndex, and hitIndex are
used by singleEdges.R to create multiplicity graphs of the hits (see
e.g. figure 2). The user can specifiy whether they are interested
in viewing the full set of targets that align with a single query or
vice versa. edges.R uses the same inputs as singleEdges.R
and creates a single figure, edges.pdf, which contains the multiplicity
information about all queries and all hits (see e.g. figure 3).
|
|
|
|