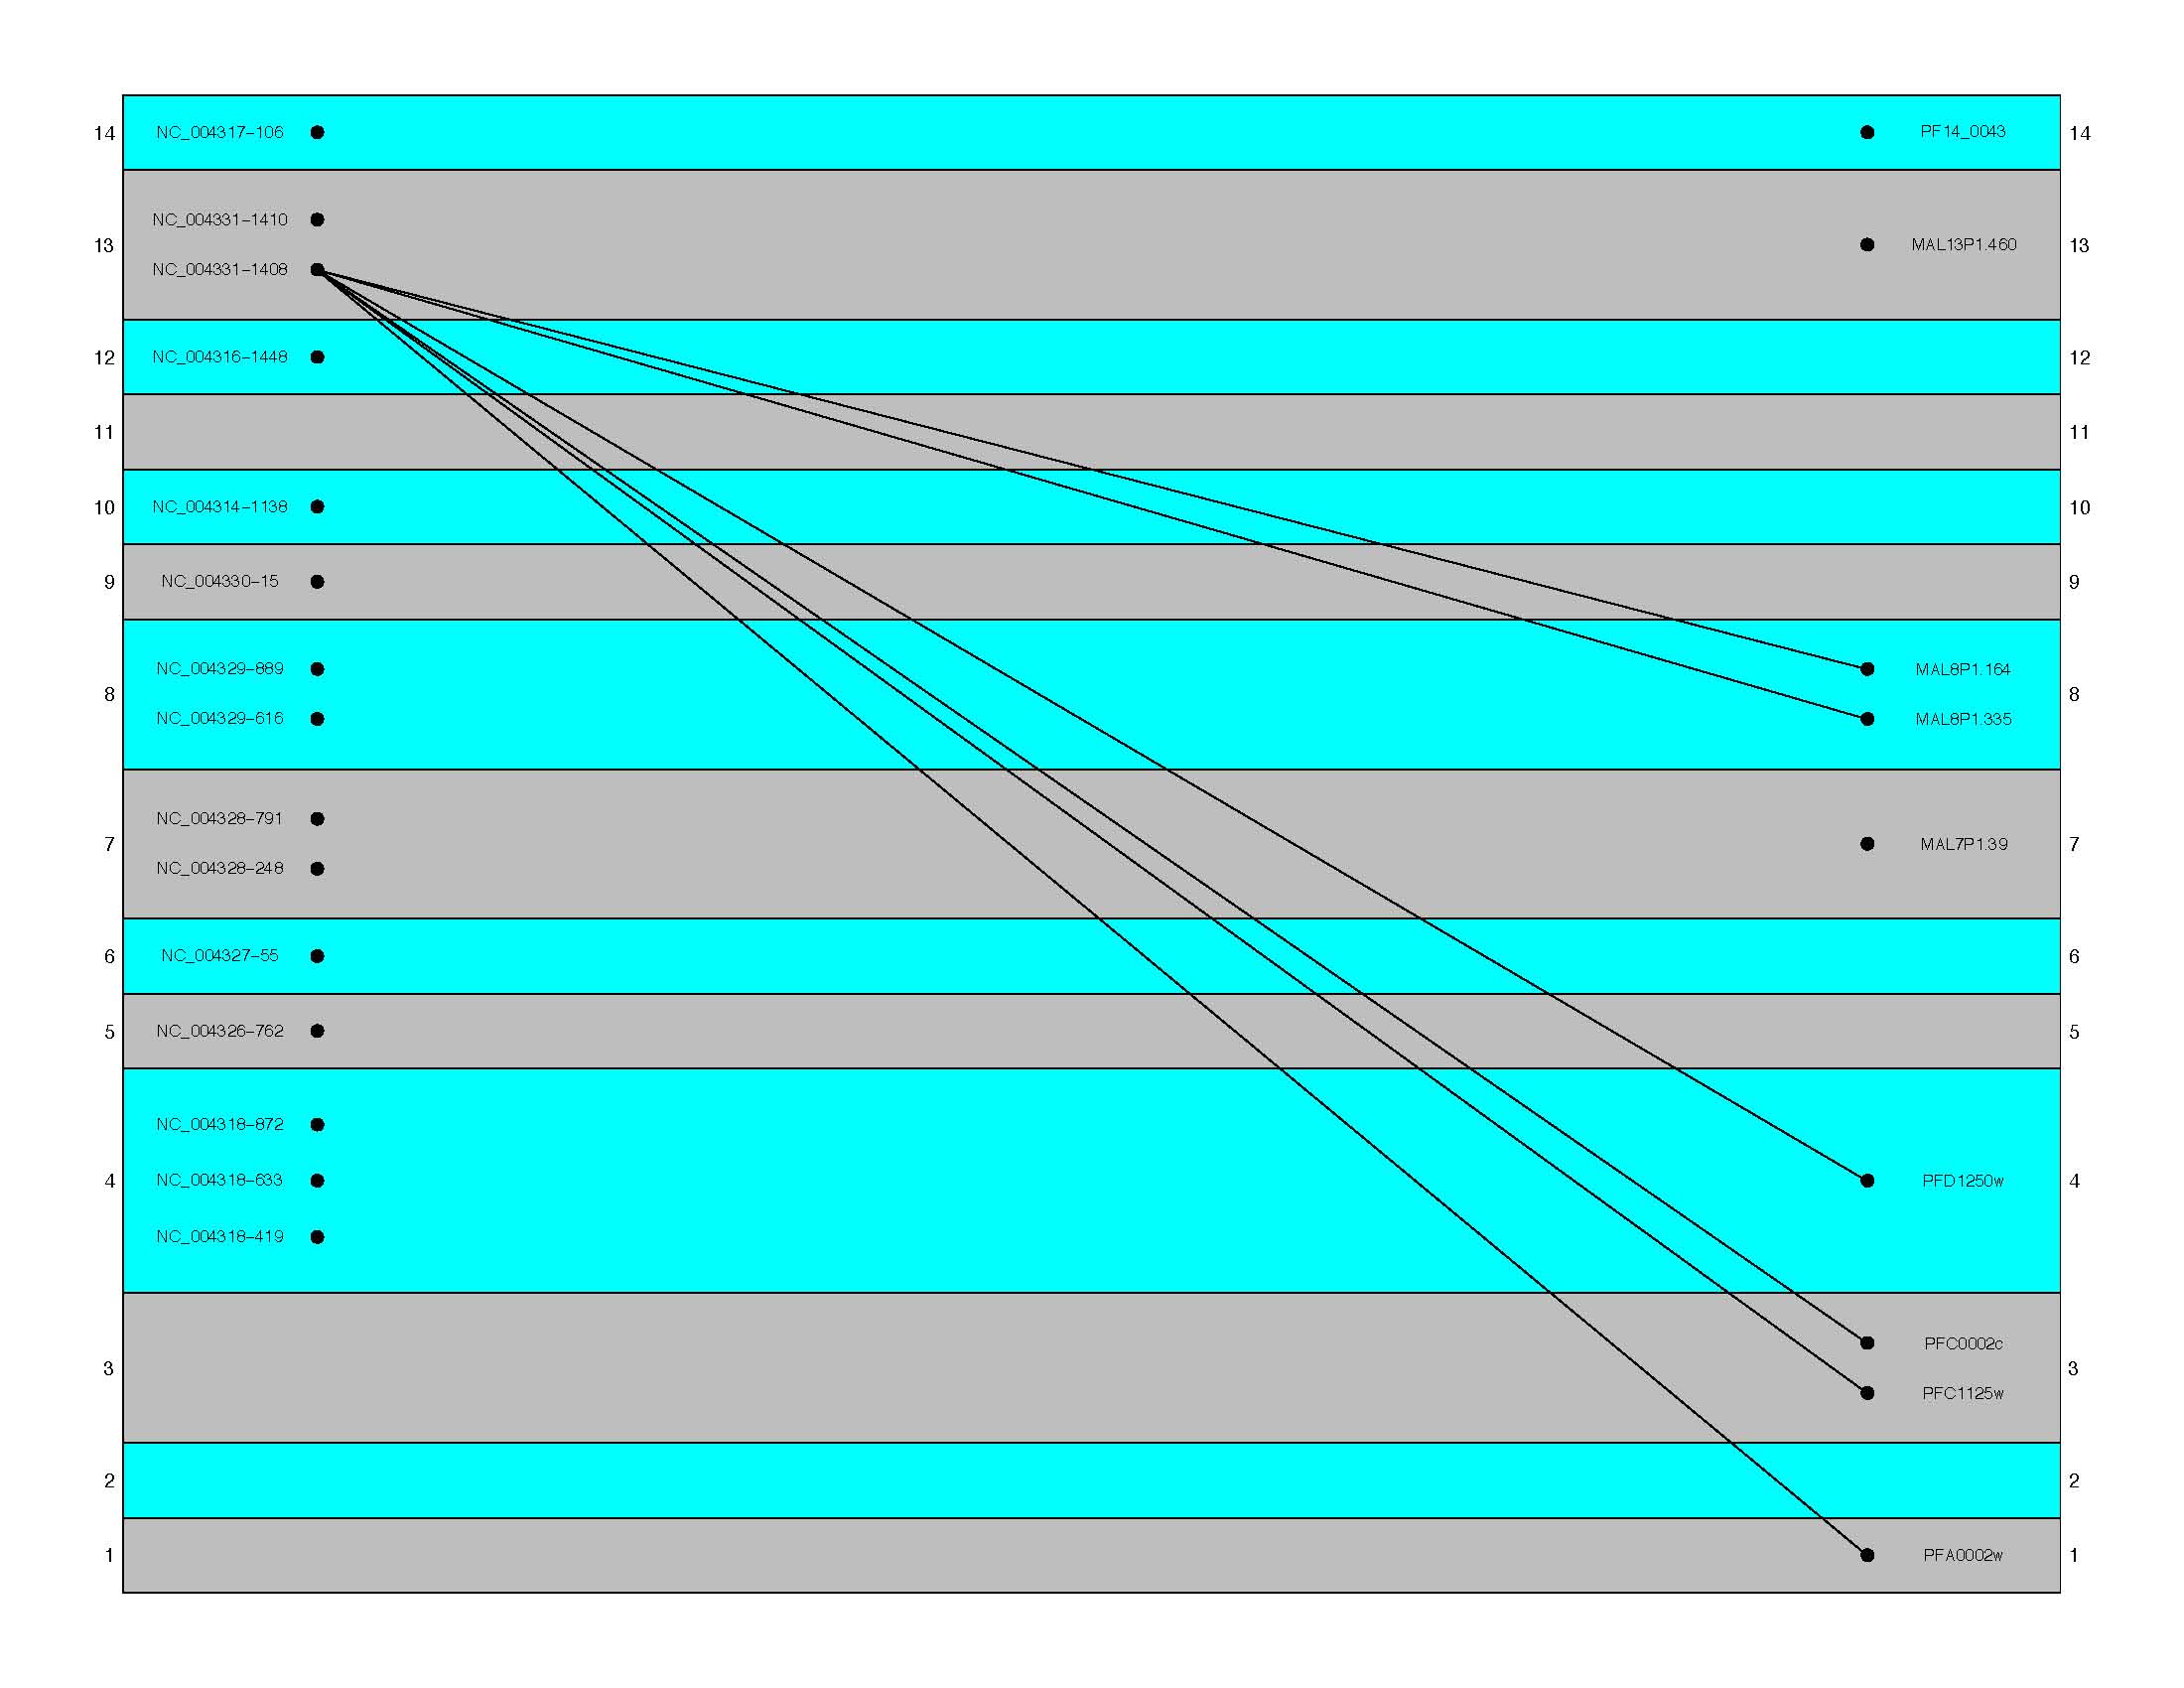
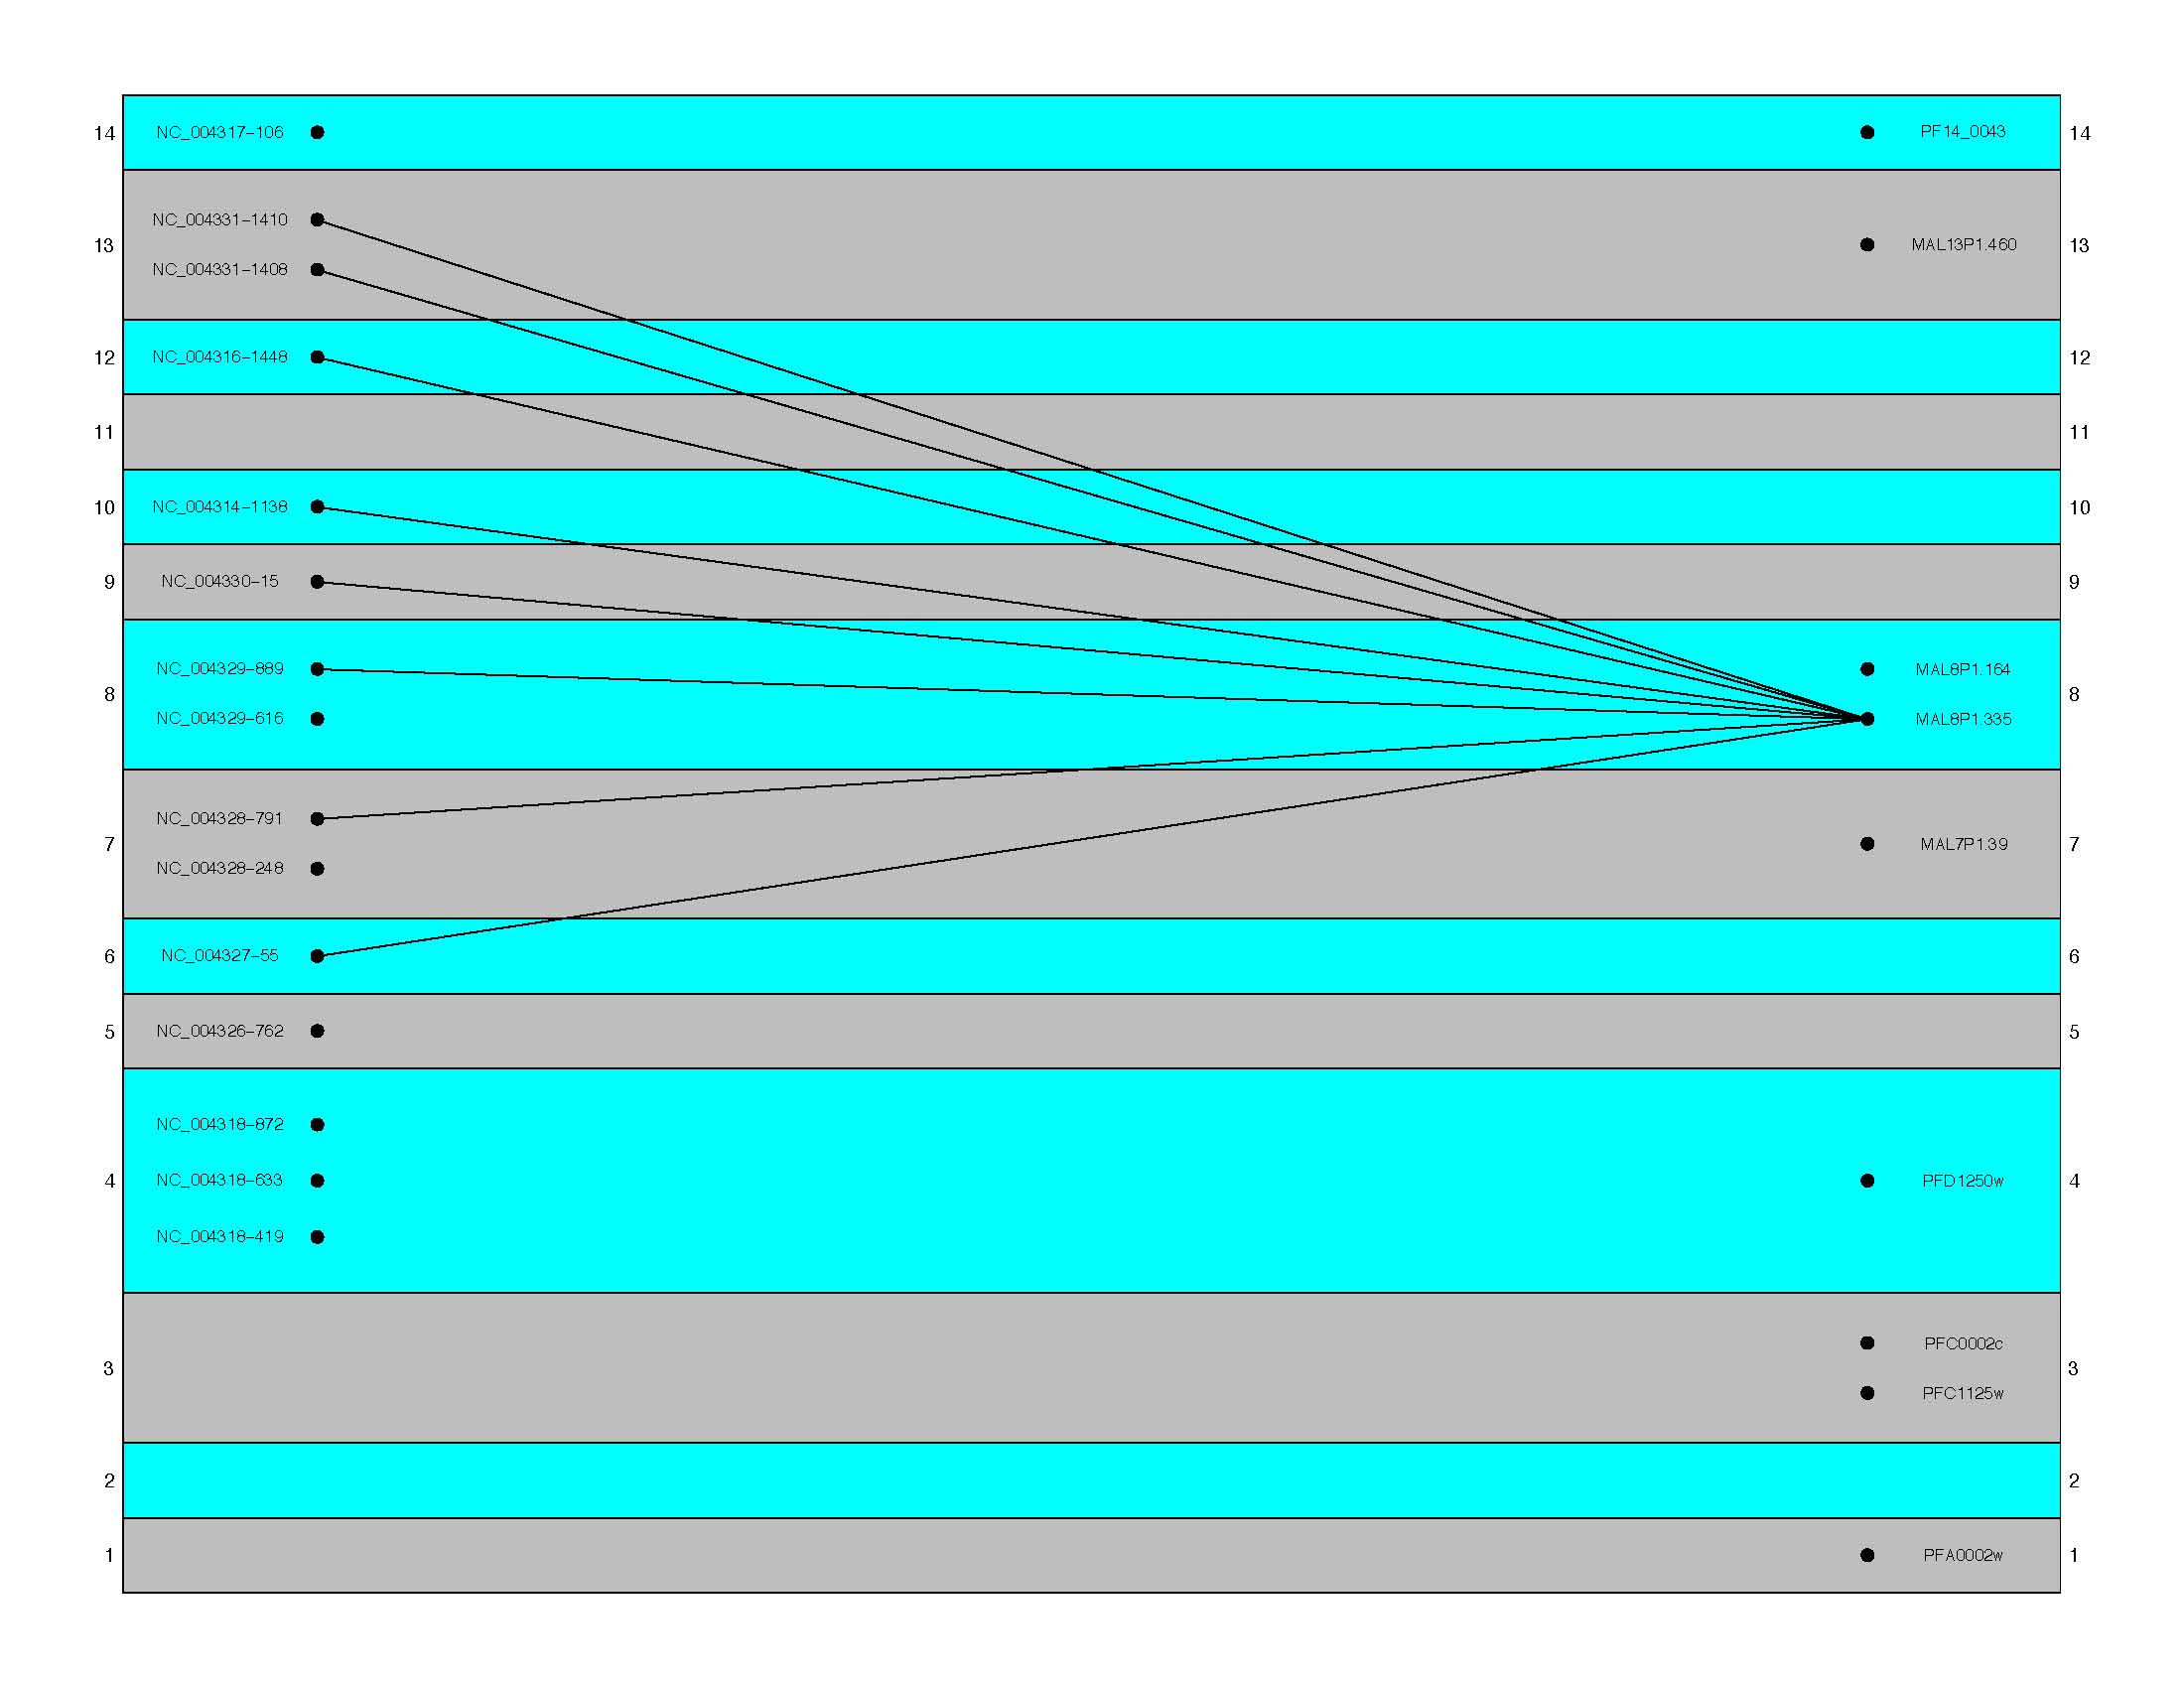
This R script takes the output from the
blast.pl script, a hash file containing query names and their respective chromosome numbers (
queryIndex) and a hash file containing hit names and their respective chromosome
numbers (
hitIndex). The script outputs either one
PDF per query or per target (depending on the user's liking). Each
PDF contains nodes for all queries and targets, but unlike the output from
edges.R,
which is a many-to-many diagram, this script creates either a
one-to-many (all targets matched by a single query) or a many-to-one
(all queries which match a single target) diagram.
*These files must all be in the same directory as the R script.
Before this script can be run, you must ensure that there is a sub-directory named "edges". The script creates
PDF files
and places them there. If no such directory is created the
following error (or something similar) will be generated:
Error in pdf(paste(outDir, targetName, ".pdf", sep = ""), width = pageWidth, :
unable to start device pdf
The R scripts are all made so that they can be sourced into R. From an R prompt type:
> source("singleEdges.R")
Output: