Code file

The code for the mvtsplot function is contained in the file mvtsplot.R which is also listed in its entirety below. You can source the file directly into R by calling

    source("http://www.biostat.jhsph.edu/~rpeng/RR/mvtsplot/mvtsplot.R")
    

The code is licensed under the GNU General Public License version 2, or any later version. There is a git repository hosting the latest version of the code. If you would like to make changes, please feel free to clone the repository and send me your patches.

There is also a short article published in the Journal of Statistical Software that describes the function and provides some examples of its usage. The examples below are taken from the article; code for reproducing the examples is available on the Journal's website.
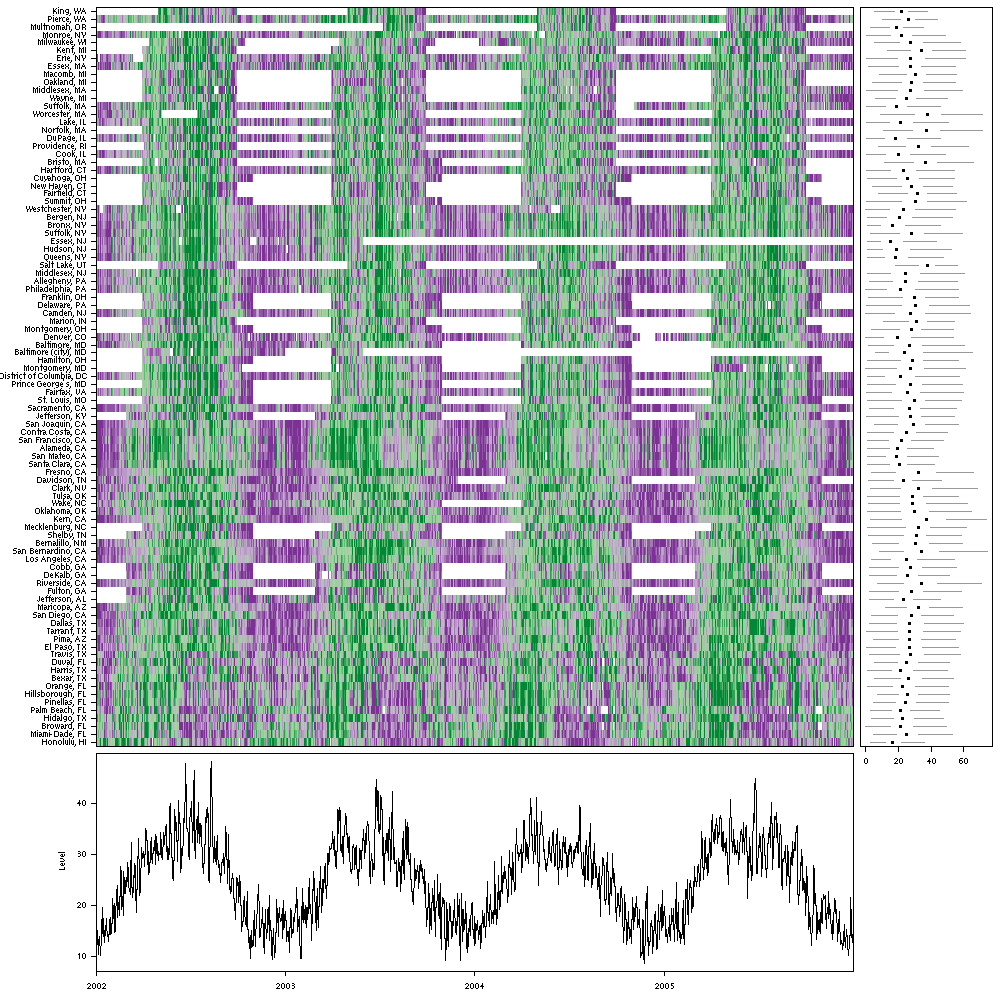
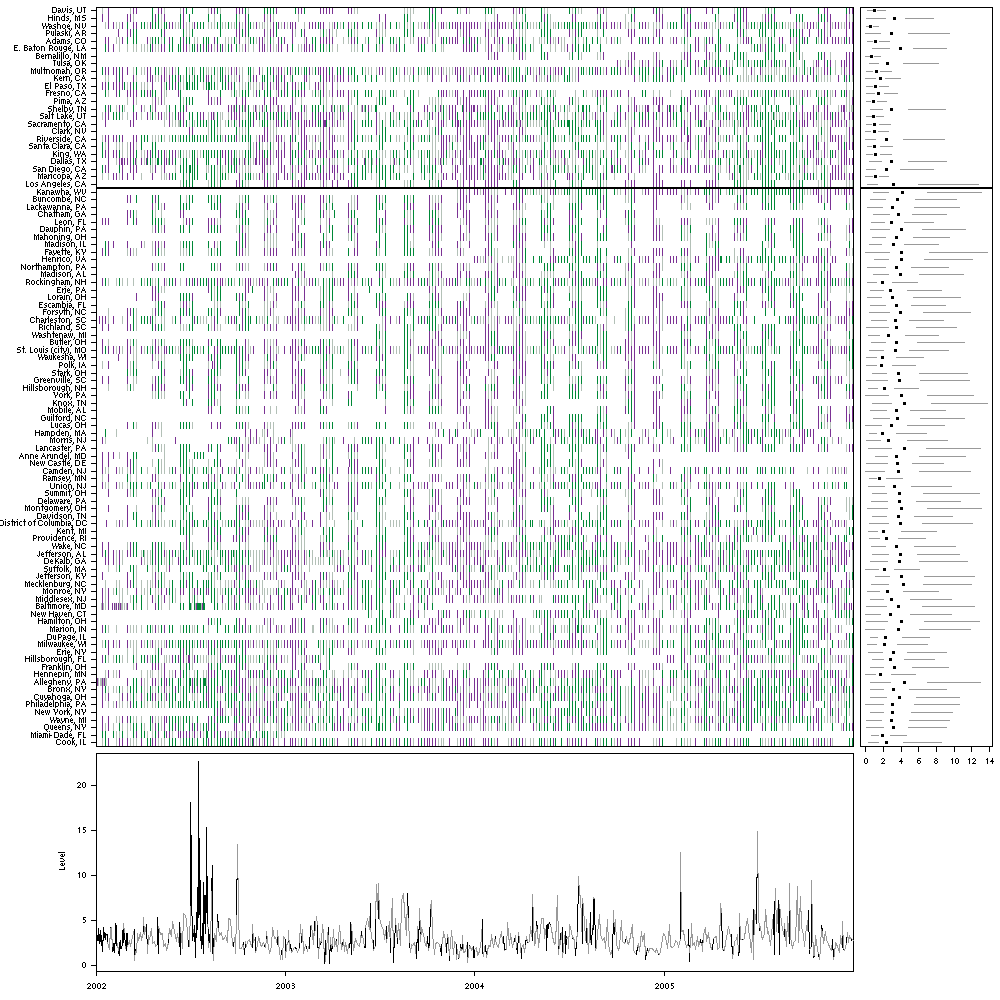
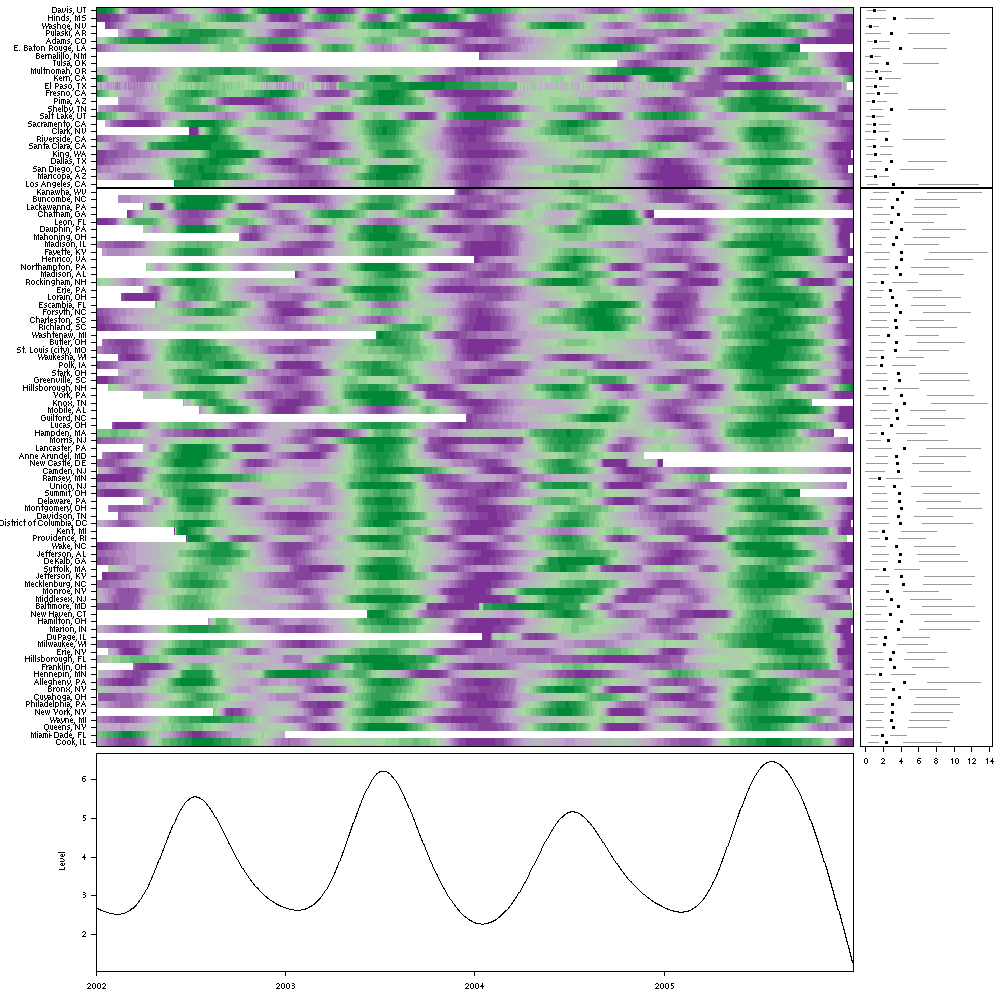
Examples

Code listing

################################################################################
## Copyright (C) 2008 Roger D. Peng 
## 
## This program is free software; you can redistribute it and/or modify
## it under the terms of the GNU General Public License as published by
## the Free Software Foundation; either version 2 of the License, or
## (at your option) any later version.
## 
## This program is distributed in the hope that it will be useful,
## but WITHOUT ANY WARRANTY; without even the implied warranty of
## MERCHANTABILITY or FITNESS FOR A PARTICULAR PURPOSE.  See the
## GNU General Public License for more details.
## 
## You should have received a copy of the GNU General Public License
## along with this program; if not, write to the Free Software
## Foundation, Inc., 51 Franklin Street, Fifth Floor, Boston, MA
## 02110-1301, USA
################################################################################

library(splines)


mvtsplot <- local({
        drawImage <- function(cx, pal, nlevels, xlim, cn, xtime, group, gcol) {
                par(las = 1, cex.axis = 0.6)
                cn <- colnames(cx)
                nc <- ncol(cx)
                side2 <- 0.2

                ## Setup image plot
                if(!is.null(cn)) 
                        side2 <- max(side2, max(strwidth(cn, "inches")) + 0.1)
                else
                        cn <- as.character(1, nc)
                par(mai = c(0.4, side2, 0.1, 0.1))
                image(unclass(xtime), seq_len(nc), cx, col = pal(nlevels),
                      xlim = xlim, xaxt = "n", yaxt = "n", ylab = "", xlab = "")
                axis(2, at = seq_len(nc), cn)
                Axis(xtime, side = 1)
                box()

                if(!is.null(group)) {
                        usrpar <- par("usr")
                        par(usr = c(usrpar[1:2], 0, 1))
                        tg <- table(group)[-nlevels(group)]
                        abline(h = cumsum(tg) / nc, lwd = 2, col = gcol)
                }
        }

        drawImageMargin <- function(cx, pal, nlevels, xlim, cn, xtime, group,
                                    gcol, smooth.df, rowm, nr, bottom.ylim, colm, right.xlim,
                                    main) {
                op <- par(no.readonly = TRUE)
                on.exit(par(op))
                par(las = 1, cex.axis = 0.6)

                cn <- colnames(cx)
                nc <- ncol(cx)
                side2 <- 0.55
                utime <- unclass(xtime)

                layout(rbind(c(1, 1, 1, 1, 1, 1, 3),
                             c(1, 1, 1, 1, 1, 1, 3),
                             c(1, 1, 1, 1, 1, 1, 3),
                             c(2, 2, 2, 2, 2, 2, 4)))

                ## Setup image plot
                if(!is.null(cn))
                        side2 <- max(0.55, max(strwidth(cn, "inches")) + 0.1)
                else
                        cn <- rep("", nc)
                par(mai = c(0.05, side2, 0.1, 0.05))
                image(utime, seq_len(nc), cx, col = pal(nlevels),
                      xlim = xlim, xaxt = "n", yaxt = "n", ylab = "", xlab = "")
                axis(2, at = seq_len(nc), cn)
                box()

                if(!is.null(group)) {
                        usrpar <- par("usr")
                        par(usr = c(usrpar[1:2], 0, 1))
                        tg <- table(group)[-nlevels(group)]
                        abline(h = cumsum(tg) / nc, lwd = 2, col = gcol)
                }
                ## Plot bottom
                if(!is.null(smooth.df)) {  ## Smooth row stats
                        xx <- seq_along(rowm)
                        tmp.fit <- lm(rowm ~ ns(xx, smooth.df),
                                      na.action = na.exclude)
                        rowm <- predict(tmp.fit)
                }
                bottom.ylim <- if(is.null(bottom.ylim))
                        range(rowm, na.rm = TRUE)
                else
                        bottom.ylim
                par(mai = c(0.4, side2, 0.05, 0.05))
                plot(utime, rep(0, nr), type = "n",
                     ylim = bottom.ylim, xaxt = "n", xlab = "", ylab = "Level")
                par(usr = c(xlim, par("usr")[3:4]))
                nalines(utime, rowm)
                Axis(xtime, side = 1)

                ## Plot right side
                right.xlim <- if(is.null(right.xlim))
                        range(colm, na.rm = TRUE)
                else
                        right.xlim
                par(mai = c(0.05, 0.05, 0.1, 0.1))
                plot(colm[3,], 1:nc, type = "n", ylab = "", yaxt = "n",
                     xlab = "", xlim = right.xlim)

                usrpar <- par("usr")
                par(usr = c(usrpar[1:2], 0, 1))
                ypos <- (1:nc - 1 / 2) / nc

                segments(colm[1, ], ypos, colm[2, ], ypos, col = gray(0.6))
                segments(colm[4, ], ypos, colm[5, ], ypos, col = gray(0.6))
                points(colm[3,], ypos, pch = 19, cex = 0.6)

                if(!is.null(group))
                        abline(h = cumsum(tg) / nc, lwd = 2, col = gcol)

                ## Plot lower right
                blankplot()
                text(0, 0, main)

                rval <- list(z = cx, rowm = rowm, colm = colm)
                invisible(rval)
        }

        blankplot <- function() {
                plot(0, 0, xlab = "", ylab = "", axes = FALSE, type = "n")
        }

        ## Discretize columns of a matrix in to categories defined by 'levels'

        catcols <- function(x, levels, norm) {
                if(norm == "internal") {
                        ## Each column gets its own set of categories
                        apply(x, 2, function(y) categorize(y, levels))
                }
                else {
                        ## Use a 'global' set of categories
                        xv <- as.vector(x)
                        y <- categorize(xv, levels)
                        matrix(y, nrow = nrow(x), ncol = ncol(x))
                }
        }

        ## Discretize a vector 'x' into categories defined by 'levels'.

        categorize <- function(x, levels, jitter = TRUE) {
                ## 'x' is a vector; 'levels' is a single integer, or a vector
                ## of quantiles
                if(length(levels) == 1)
                        levels <- seq(0, 1, len = levels + 1)
                qq <- quantile(x, levels, na.rm = TRUE)
                qqu <- unique(qq)

                if(length(qqu) != length(qq)) {
                        if(!jitter)
                                return(rep(NA, length(x)))
                        qqu <- try(suppressWarnings({
                                x <- jitter(x)
                                qq <- quantile(x, levels, na.rm = TRUE)
                                unique(qq)
                        }), silent = TRUE)
                        if(inherits(qqu, "try-error") || length(qqu) != length(qq))
                                return(rep(NA, length(x)))
                }
                cx <- cut(x, qqu, include.lowest = TRUE)
                as.numeric(unclass(cx))
        }

        smoothX <- function(x, df) {
                apply(x, 2, function(v) splineFillIn(v, df))
        }

        reorderCols <- function(x, group) {
                if(length(group) != ncol(x))
                        stop("'group' vector should equal 'ncol(x)'")
                idx.split <- split(seq_len(ncol(x)), group)
                idx.reordered <- unlist(idx.split)
                x[, idx.reordered, drop = FALSE]
        }

        rangeby <- function(x, f) {
                use <- complete.cases(x, f)
                range(x[use])
        }

        splineFillIn <- function(x, df) {
                if(all(is.na(x)))
                        return(x)
                tt <- seq_along(x)
                rng <- rangeby(tt, x)
                fit <- lm(x ~ ns(tt, df), na.action = na.exclude)
                idx <- seq(rng[1], rng[2])
                x[idx] <- suppressWarnings({
                        predict(fit, data.frame(tt = idx))
                })
                x
        }

        sumNA <- function(x) {
                if(all(is.na(x)))
                        NA
                else
                        sum(x, na.rm = TRUE)
        }

        checkMatrix <- function(x) {
                if(!is.matrix(x))
                        stop("'x' should be a matrix")
                if(ncol(x) < 2)
                        stop("'x' should have more than 1 column")
                if(nrow(x) < 2)
                        stop("'x' should have more than 1 row")
                TRUE
        }

        ## This function is like 'lines' in that it draws lines between
        ## points.  For two points that are consecutive, the line is drawn
        ## "black".  If one or more missing values is between two points, then
        ## the line is drawn grey (or 'NAcol').

        nalines <- function(x, y, NAcol = gray(0.6), lattice = FALSE, ...) {
                use <- complete.cases(x, y)
                idx <- which(use)
                n <- length(idx)

                if(n < 2)
                        return(invisible())
                for(i in seq_len(n - 1)) {
                        j <- idx[i]
                        k <- idx[i+1]
                        col <- if((k - j) > 1)
                                NAcol
                        else
                                "black"
                        if(lattice)
                                llines(c(x[j], x[k]), c(y[j], y[k]), col = col)
                        else
                                lines(c(x[j], x[k]), c(y[j], y[k]), col = col)
                }
                invisible()
        }


        function(x, group = NULL, xtime = NULL,
                 norm = c("internal", "global"), levels = 3,
                 smooth.df = NULL, margin = TRUE,
                 sort = NULL,
                 main = "", palette = "PRGn",
                 rowstat = "median",
                 xlim, bottom.ylim = NULL,
                 right.xlim = NULL,
                 gcol = 1) {
                if(is.data.frame(x))
                        x <- data.matrix(x)
                checkMatrix(x)
                norm <- match.arg(norm)

                if(!is.null(sort))
                        sort <- match.fun(sort)
                rowstat <- match.fun(rowstat)

                if(!require(RColorBrewer))
                        stop("'RColorBrewer' package required")
                if(is.null(xtime)) {
                        xtime <- seq_len(nrow(x))
                        xlim <- c(0, max(xtime))
                }
                else
                        xlim <- range(xtime)
                if(!is.null(group)) {
                        group <- as.factor(group)
                        x <- reorderCols(x, group)
                }
                if(!margin && !is.null(sort)) {
                        stat <- apply(x, 2, sort, na.rm = TRUE)
                        x <- x[, order(stat)]
                }
                if(margin) {
                        colm <- apply(x, 2, function(x) {
                                grDevices::boxplot.stats(x)$stats
                        })
                        if(!is.null(sort)) {
                                stat <- apply(x, 2, sort, na.rm = TRUE)
                                ord <- order(stat)
                                x <- x[, ord]
                                colm <- colm[, ord]
                        }
                }
                if(is.null(smooth.df))
                        cx <- catcols(x, levels, norm)
                else {
                        x <- smoothX(x, smooth.df)
                        cx <- catcols(x, levels, norm)
                }
                if(margin)
                        rowm <- apply(x, 1, rowstat, na.rm = TRUE)
                colnames(cx) <- colnames(x)
                empty <- apply(cx, 2, function(x) all(is.na(x)))

                if(any(empty)) {  ## Remove empty columns
                        cx <- cx[, !empty]

                        if(margin)
                                colm <- colm[, !empty]
                }
                pal <- colorRampPalette(brewer.pal(4, palette))

                nlevels <- if(length(levels) == 1)
                        levels
                else
                        length(levels)
                if(margin)
                        drawImageMargin(cx, pal, nlevels, xlim, cn, xtime,
                                        group, gcol, smooth.df, rowm, nrow(x),
                                        bottom.ylim, colm, right.xlim, main)
                else
                        drawImage(cx, pal, nlevels, xlim, cn, xtime, group, gcol)
        }

})