Invasion Model
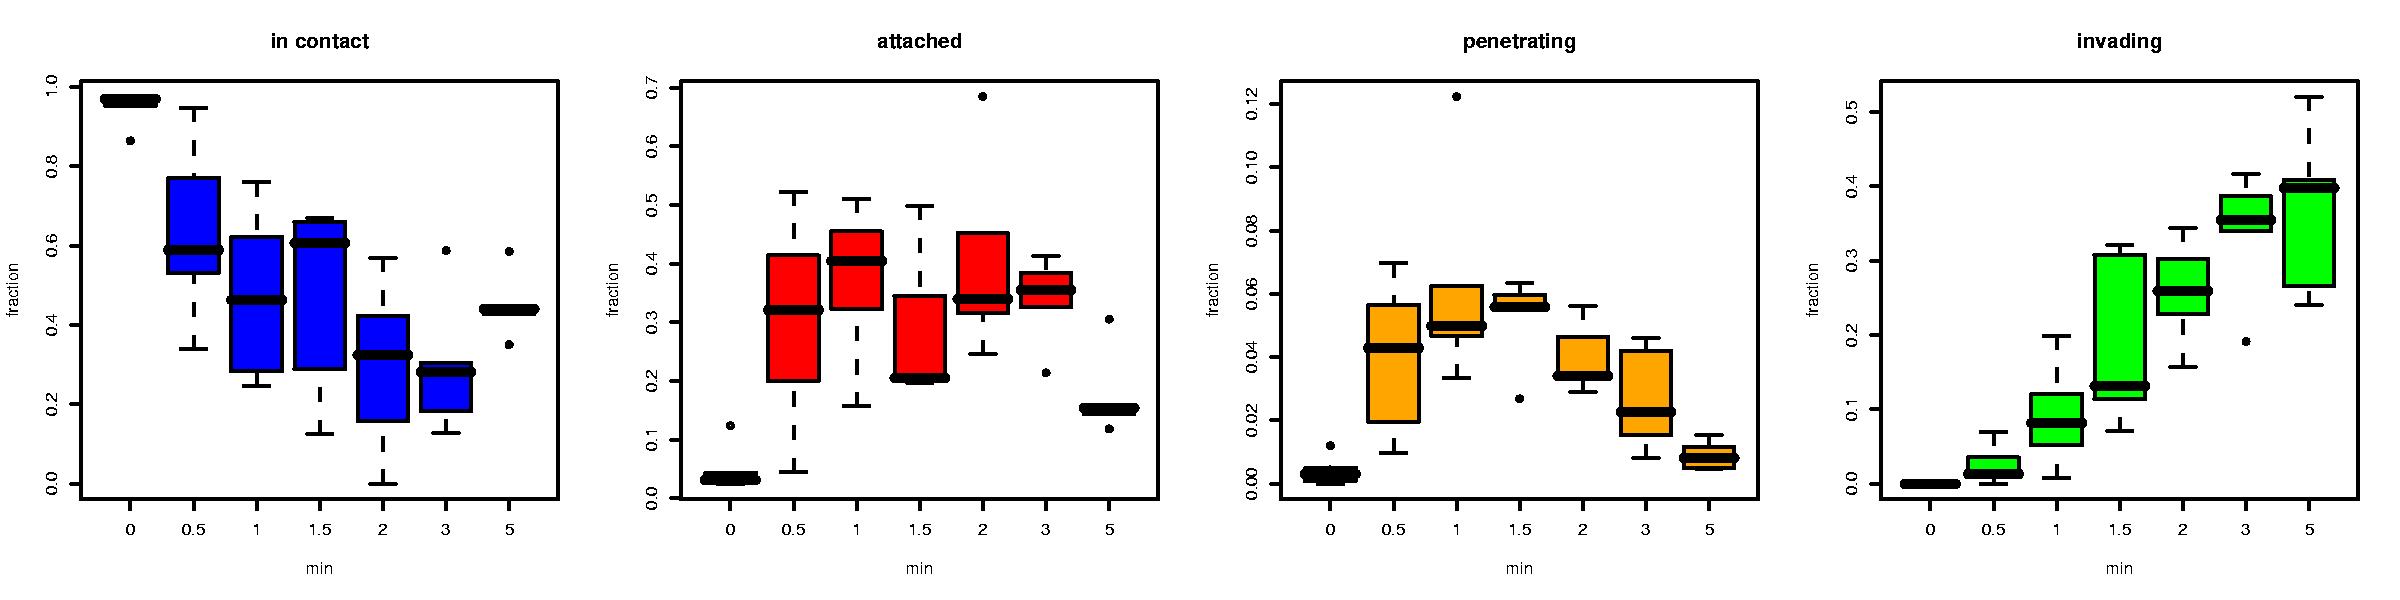
Synchronized Toxoplasma invasion was followed by determining the
fraction of parasite in each of five defined states at various
timepoints. Three of these
states (Attached, Penetrating, Invaded) are directly observable, while the sum of the remaining states (Contact, Detached) is infered by subtracting the three observed states from the total number of parasites in the system.
We devised the model below to explain the data.
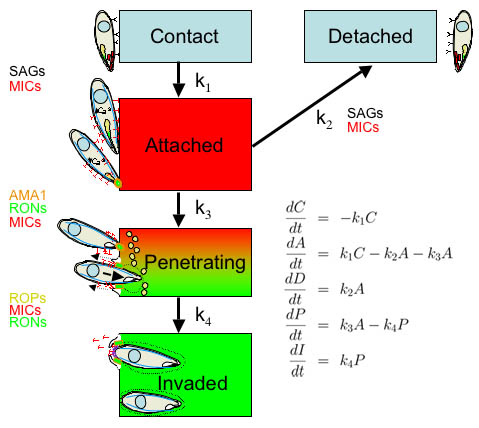
The behavior of the system is governed by a system of 5 ordinary linear differential equations and dependent on 4 distinct variables as well as
the intial conditions for each state. To avoid overfitting we did not
fit the initial conditions as independent variables but posited 100% of
parasite to be in the "Contact" state at t=0.
The states are defined as
"Contact": Parasites in
close proximity to host cells but attached only weakly
such that they are removed by rinsing the monolayer. Change of this state is controlled by the rate at which parasites become strongly attached (k1).
"Attached": Parasites in close proximity to host cells that could not
be removed from the monolayer by rinsing. These parasites
stain red in the Red/Green assay (See methods). Change of this state is controlled by the rate at which parasites become strongly attached (k1), the rate at which their attachement weakens (k2), and the rate at which they initiate penetration of the host cell plasma membrane (k3).
"Detached": Parasites that were temporarily attached but failed to initiate penetration and were washed away by rinsing. "Detached" parasites are unable to reattach in the time scale modeled. Change of this state is controlled by the rate which attachement
weakens (k2).
"Penetrating": Parasites in the
process of penetrating the host-cell plasma membrane. These parasites
stain red at extracellular distal end and green at the intracellular apex in the Red/Green
assay. Change of this state is controlled by the rate that penetration is initiated (k3) and the rate at which invasion is completed (k4).
"Invaded": Parasites that have
completed their invasion of a host-cell and stain green in the
Red/Green assay. Change of this state is controlled by the rate at which invasion is completed (k4).
The fraction of parasites in each of these States depends on 4 Transitional Rates:
k1 Rate at which Parasite become attached to host cells.
k2 Rate at which parasited detach from host cells.
k3 Rate at which tightly attached parasites inititate penetration of the host cell plasma membrane.
k4 Rate at which penetrating parasites complete penetration.
By fitting these rate to optimaly match the data we can gain deeper inside into this host-pathogen interaction. For example it can be used for detailed phenotyping of the invasion mutants or to discern differences in invasion of different host cell types.