

|
Tutorial 2: Tiling Array Analysis |
|
Before analyzing tiling array data, you need to create a tiling data set first. Here we first illustrate how to create such a data set from Affymetrix’s CEL and BPMAP files.
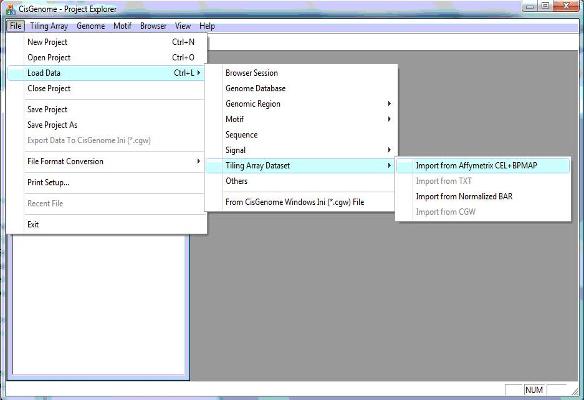
1.1 In the menu system, click “File > Load Data > Tiling Array Dataset > Import from Affymetrix CEL+BPMAP”, as shown below. |
1. Create a tiling array project |
|
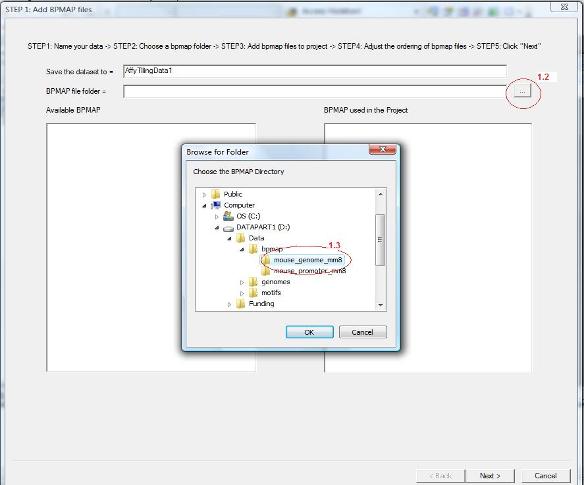
1.2 A wizard dialog will jump out to guide you through the remaining procedure. In the first page of the dialog, give a name for the data set. You should then choose a folder that contains bpmap files. This is illustrated in the screen shot below. First click the button highlighted by the red circle 1.2.
1.3 A folder dialog will jump out, choose the bpmap folder in the dialog (see circle 1.3), and then click the “OK” button. |
|
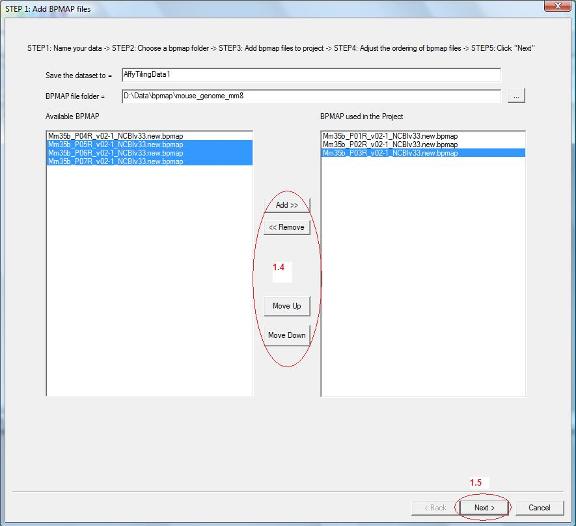
1.4 Now all bpmap files in the chosen folder will be loaded to the list box on the left hand side. Find out which bpmap files are needed by the project, select them and click the “Add” button. They will be added to the list box on the right. Use “Move Up” and “Move Down” button to adjust the order of bpmap files (See red circle 1.4).
1.5 After you added bpmap files and ordered them appropriately, click “Next” on the bottom (See red circle 1.5). |
|
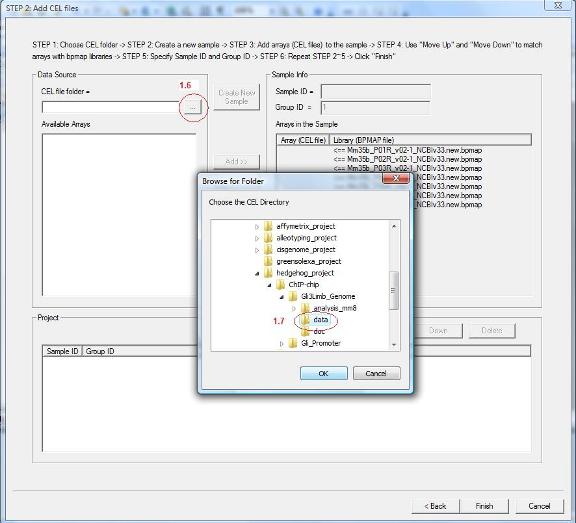
1.6 You will be guided to a new wizard page. Here you need to add CEL files to the data set. First, specify the folder that contains your CEL files by clicking the button highlighted by red circle 1.6.
1.7 A dialog will jump out. In the dialog, choose the CEL file folder (red circle 1.7), then click the “OK” button. |
|
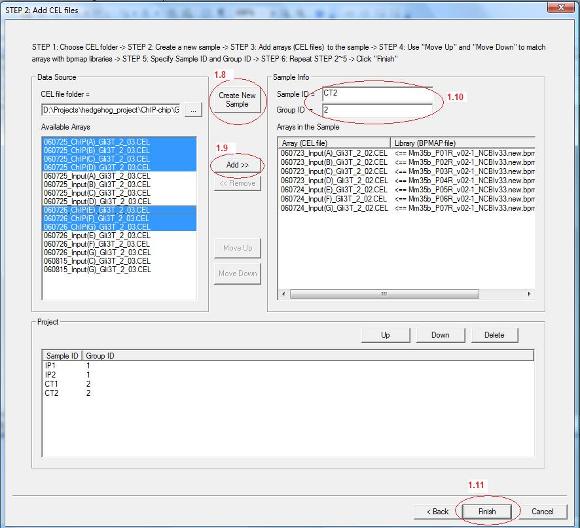
1.8 Now all CEL files in the chosen folder will be loaded to the list box on the left. You can then add samples (e.g., IP1, IP2, Input1, Input2) to your project. Each sample can contain one or more CEL files depending on what types of chips you are using. For example, if you use mouse whole genome 7-array set, each sample will contain 7 CEL files. If you use promoter arrays, each sample will contain 1 array. To add a sample, click “Create New Sample” button (see red circle 1.8 below).
1.9 A new sample is now added to the project. You can then select CEL files from the “Available Arrays” list box, and add them to the new sample by clicking “Add” (red circle 1.9). After you add CEL files, you can use “Move Up” and “Move Down” button to match them with bpmap files.
1.10 You also need to give a sample name (i.e. Sample ID) and a group ID for each sample (red circle 1.10). The group ID is used for future analysis. For example, if you wish to compare IP and Input in a ChIP-chip experiment, you can set group ID = 1 for all IP samples, and set group ID = 2 for all Input samples. Later you can ask the program to search for pattern “1>2”.
1.11 After you add all samples, click “Finish” on the bottom (red circle 1.11). |
|
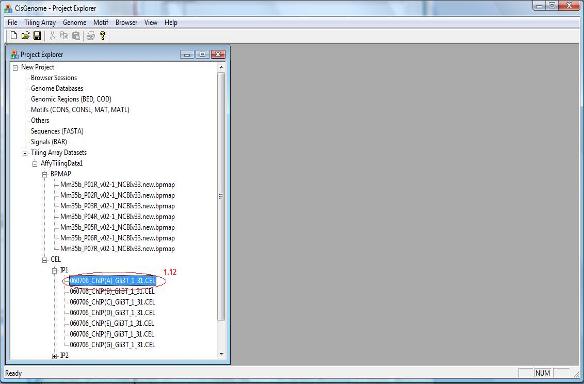
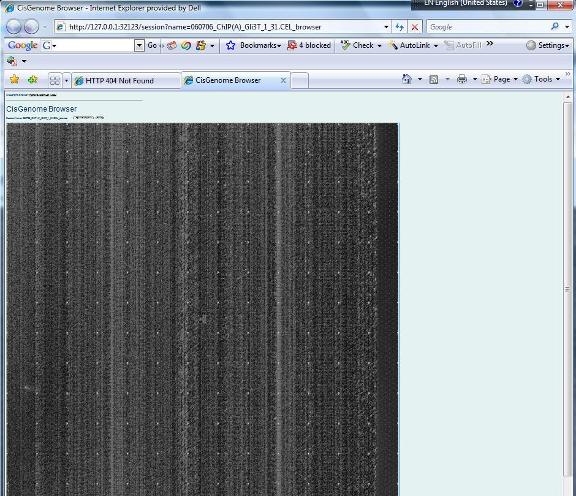
1.12 You have now created an affymetrix tiling array data set. The data set will be automatically added to the “Project Explorer” window of CisGenome. You can expand the tree view in the Project Explorer window. If everything is correct, when you double click a CEL file, a heat map will show up to allow you to check the raw array image.
|
|
Do you get the image? If yes, congratulations! You are now ready to proceed to the next step: analyzing the data. |