Developing Digital Karyotyping package
for detecting DNA copy amplifications
Abstract
Alterations in the genetic content of a cell are the underlying cause of many human diseases, including cancers. The digital karyotyping provides quantitative analysis of DNA copy number at high resolution. This approach uses the comprehensive exanimation of cellular DNA content based on short sequence tags from specific genomic loci. We develop the R package to implement the analysis approach and improve analysis by introducing a formal framework for statistical inference under Poisson distribution assumption. We also provide a function for making relevant plots of these data and analyzed results.
Background
Digital Karyotyping (DK) is a method that provides quantitative analysis of DNA copy number at high resolution. DK uses cleaving enzymes to obtain unique tags (short but representative DNA sequences) at approximately 4 kb intervals along the entire genome. The DNA tags are amplified, and then identified and counted by sequencing and tallied. Many copies indicate amplification, while few copies suggest a deletion. A full description of the DK approach, detailed protocol for DK and sample data are available at the DK website http://www.digitalkaryotyping.org/.
The goal of DK data analysis is to identify genomic regions in which tag counts are consistently higher or lower than expected by chance alone. In this project we concentrate on amplifications, but the basic ideas extend to deletions as well. The current approach to identifying the amplifications is to average the gene specific DNA copy numbers in a sliding window, comparing results to a null distribution obtained by permutation. Here, we save the computational expense of the simulations, and improve analysis by introducing a formal framework for statistical inference from DK data.Because our data consists of tag counts, it would be natural to consider the Poisson distribution for our model and in fact, the permutation null distribution can be completely described in terms of Poisson processes.
Package
Here we develop an R package for the analysis of DK data based on Poisson distribution assumption. In this package, we also have to consider the data structure for storage of DK data. Since there will be different chromosomes, different libraries in DK data files, how to use minimal space to contain all the information, and to classify different types of information will be our main concern. The exiting eSet, which is a general container for high-throughput assays and experimental metadata in Bioconductor, is fit for the need of our data and used as data structure template. In addition, in our R package, formulas for the calculation of power and sample size are also provided. Finally there are four implementing functions, readDK, processDK, plotDK and power in this R package.
Data
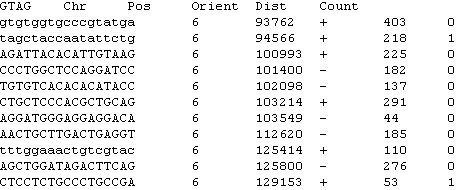
Data used in this package was generated in the lab of Dr. Tian-Li Wang at JHMI Sidney Kimmel Comprehensive Cancer Center. In DK data files, there are six columns, they are: (1) GTAG: Gene Tags (2) Chr: Chromosome number (3) Pos: Position in chromosome (4) Orient: orientation in chromosome (5) Dist: Distance (6) Count: Number of tag counts And data structure is shown below.
Methods
Scan Statistic
To identify amplified regions, we slide a window along each chromosome, looking for places where the average tag counts within a window is higher than expected by chance alone. In each sliding window, we use Poisson test as our hypothesis test. The Poisson test use sum of tag counts as test statistic is equal to likelihood ratio test for Poisson distribution, and according to Neyman-Pearson Lemma, it is a uniformly most powerful (UMP) test. Based on the Poisson test, we can calculate the corresponding p-value, however it is not the correct p-value we should use, since there is multiple testing problems arising from scanning the entire chromosome. In order to solve the problem, we performed simulations to figure out the relationship between dependence of each test.
Power Test
We anticipate that the users might concern about the sample size or power calculations. Here we also provide the functions to answer those questions above in two different cases, one is one library case and the other is multiple libraries case. In one library case, we use fold changes to describe the alternative hypothesis in Poisson test that we calculate power for. In multiple libraries case, the probability of observing at least one given mutated library is what we mean by power. We use binomial distribution with N libraries and p=p1*p2, p1 is population mutation rate and p2 is the detecting power, to answer the power.
Results
We will present the ability of DK package to detect subchromosome changes, particularly the amplifications of chromosome arm. Data is from colorectal cancer cell line (DiFi). Based on onelib.power.test, we set fold criterion to be 2, power=0.8, alpha =0.05, and then get window size to be 260.
Based on Poisson test, we can have statistical inference to identify amplification locations. Rather than just return the answers, “TRUE” or “FALSE”, judged by fold changes cut-off line, we also display relative difference by p-values.
In Chromosome 4, the difference of tag counts or folds among whole chromosomal arm are small. The distribution is quite flat. However, in p-value plot, we can see a clear amplification peak distinguished from other places.
In contrast to Chromosome 4, Chromosome 7 has a huge significant peak, it make experimenter easy to ignore the other amplification areas. Also, in p-value plot, we will the see the ohter amplifications to be revealed.
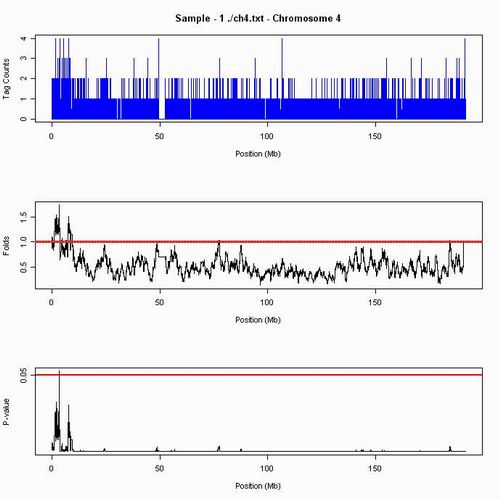
Figure 1. The greatest fold change in chromosome 4 is 1.74, and the amplifications are in location 3.25-3.35 Mb.
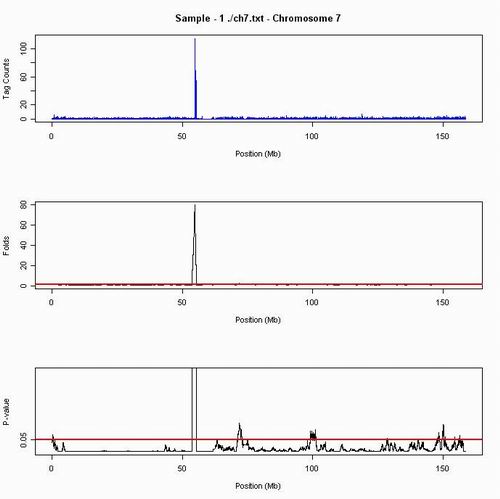
Figure 2. The greatest fold change in chromosome 4 is 80, and the amplifications are in location, 0.25-1.50, 53.75-55.50, 71-73, 99-101.5, 148-148.5, 149.5-150.2, 156.15-156.55 Mb
Reference
| 1. | Tian-Li Wang, Christine Maierhofer, Michael R. Speicher, Christoph Lengauer , Bert Vogelstein , Kenneth W. Kinzler , and Victor E. Velculescu. Digital Karyotyping. Proc Natl Acad Sci USA, Vol. 99, no. 25, 16156–16161, 2002. |
| 2. | Tian-Li Wang, Diaz LA Jr, Romans K, Bardelli A, Saha S, Galizia G, Choti M, Donehower R, Parmigiani G, Shih IeM, Iacobuzio-Donahue C, Kinzler KW, Vogelstein B, Lengauer C, Velculescu VE. Digital karyotyping identifies thymidylate synthase amplification as a mechanism of resistance to 5-fluorouracil in metastatic colorectal cancer patients. Proc Natl Acad Sci US A. 101(9):3089-94, 2004. |