Alignment Viewer
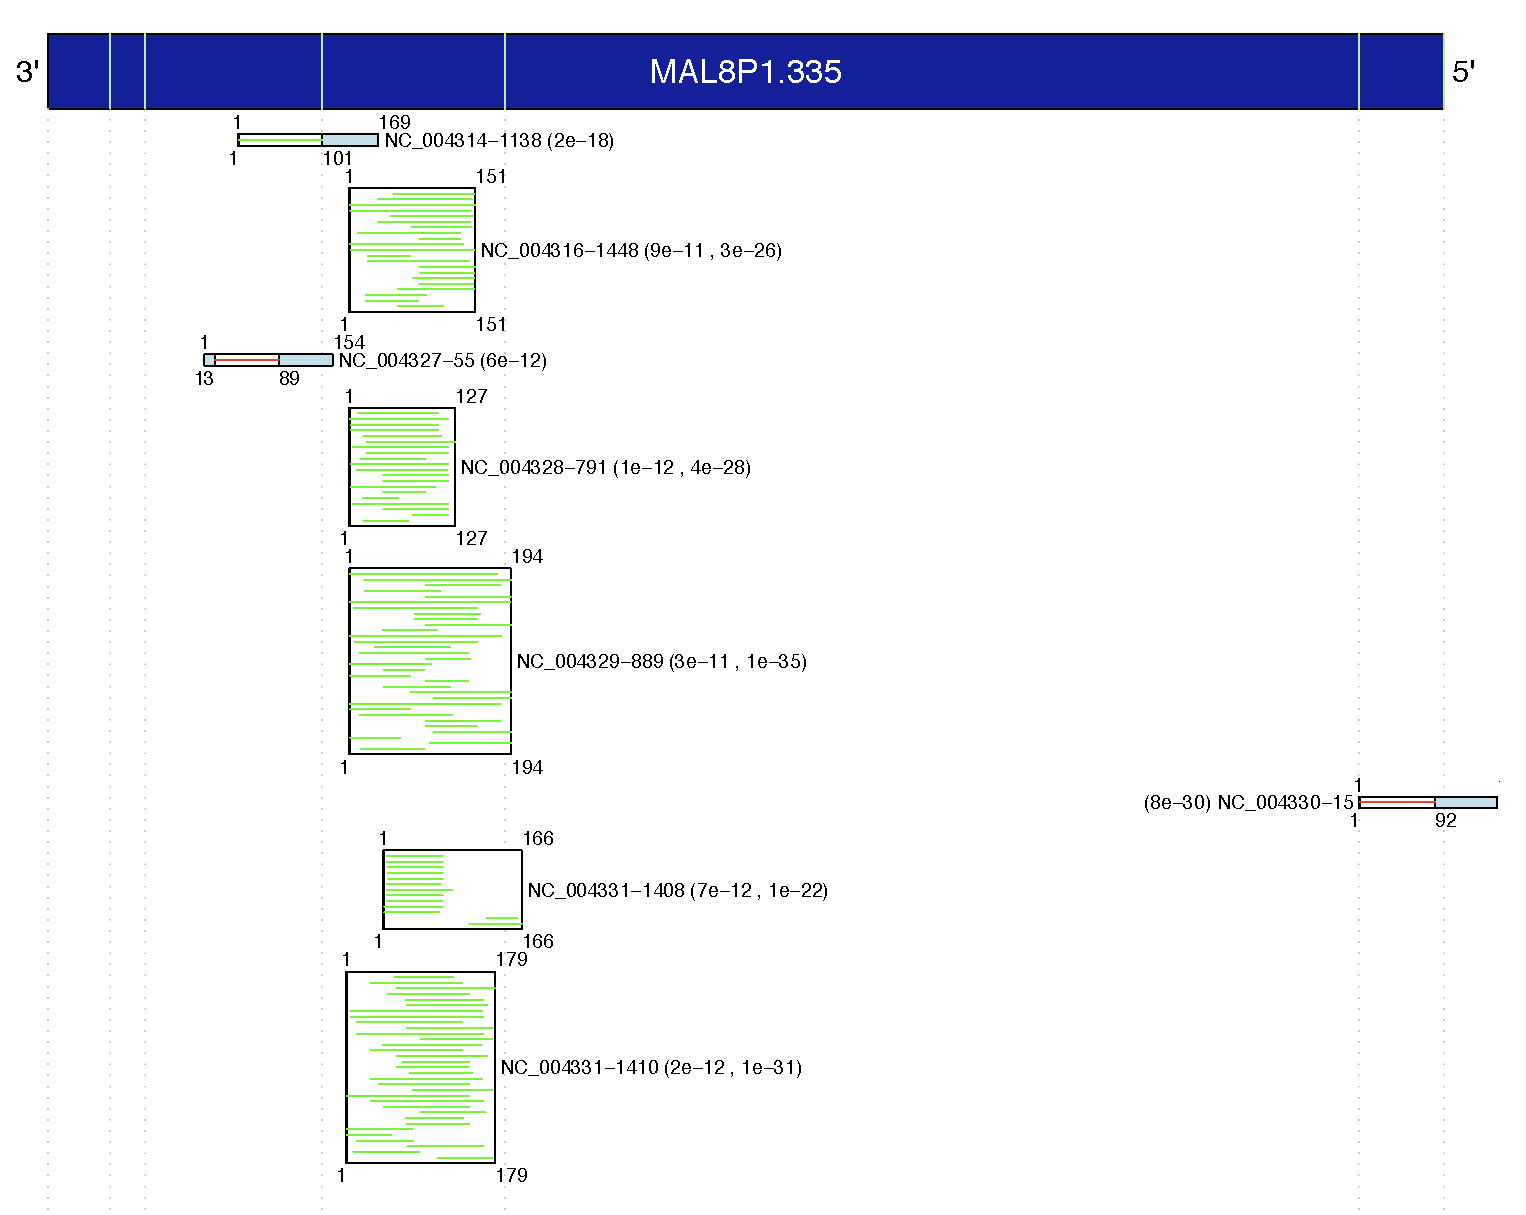
Figure 4 shows the figure generated by the alignment viewer for protein
MAL8P1.335. Each hairpin is represented by a light blue rectangle
with our accession number drawn immediately to the side. Numbers
above the rectangle show the coordinate number of the first and last
nucleotide in the hairpin. White rectangles within the hairpin
represent the extreme left and right coordinates of the matches within
the hairpin. Numbers below the white rectangles indicate the limits of
the coordinates of the high scoring pairs (HSPs). Plus / Plus
strand matches are
denoted by green lines while Plus / Minus strand matches are shown in
red. Vertical lines mark the exon boundaries of the
protein. The number(s) in parenthsis beside our accession is/are
the minimum and maximum e-vaules associated with the set of HSPs in
that hit. If there is only one HSP, then only one value is
reported.
From figure 4 we can see which regions, and even more specifically,
which exons are most heavily targeted. In the case of MAL8P1.335,
half of the hairpin sequences matched in the third exon. These
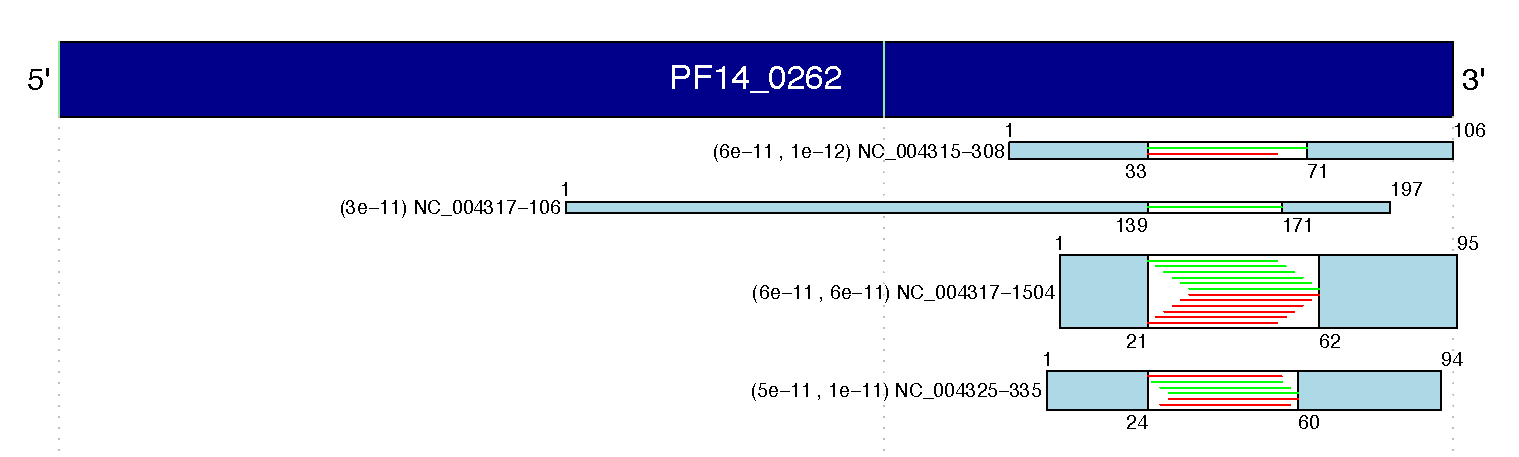
diagrams allow us to distinguish possible low-complexity hits from
group by means of the plus/plus and plus/minus strand. Figure 5
shows an alignment that was generated using the same data, only with
the low-complexity filter turned off. The pattern of Plus / Plus
and Plus / Minus matches seen in NC_004317-1504 is a likely sign of
low-complexity matching.
|
|
|
|