|
Tutorial 2: ChIP-Seq Data Analysis |
|
1.1 Download Genome Database In order to analyze your ChIP-seq data, you need to have necessary genome information stored in your local computer. This information can be obtained by downloading various genome databases from our download page. For example, if you are studying mouse, you can download our mouse genome database (e.g., mm8). This pre-compiled database contains all the necessary information required to support ChIP-seq analysis including both upstream peak detection as well as downstream visualization, annotation and sequence retrieval, and transcription factor binding motif mapping, etc.
To download a genome database, simply click the one you want to use, and save it to whatever folder you choose. The database usually have a “.gz”, “.zip” or “.exe” suffix. In the first two cases, after downloading you need to unzip the database using software such as gzip, unzip, WinZip, WinRAR etc. In the “.exe” case, the file is self-extractable, just double click it after downloading to install the database. The downloading procedure will take some time. While you are waiting, let’s continue our data preparation.
1.2 Prepare Alignment Files As the input of CisGenome, for each sample you’ve sequenced, you need to prepare a text file to provide the read-to-genome alignment information. The file should be tab-delimited and should have the following format:
chr1[tab]359077[tab]F chr1[tab]376890[tab]R ….
Here, column1 = chromosome where the read is aligned; column2 = coordinate where the read is aligned; column3 = ‘F’ or ‘+’: if the read is aligned to the forward strand of the genome assembly; ‘R’ or ‘-’: if the read is aligned to the reverse complement strand of the genome.
Most sequencing platforms will produce alignment information as part of their output. For example, data generated by Illumina/Solexa are usually aligned using ELAND algorithm. If you use these alignments, please convert them to the format specified above. If your alignment is generated by ELAND, you can convert it to the format specified above by using “File -> File Format Conversion -> ELAND->ALN”. Please make sure that the genome database you’ve downloaded from CisGenome website has the same genome assembly as the one you used to produce the alignment. ELAND does not report alignments involving insertions and deletions, if you want to allow insertions and deletions, you can do alignment by yourself using SeqMap algorithm developed by Jiang et al.
After you have downloaded the genome database and have prepared the input alignment files, you are ready to move on to the next step — creating a data analysis project. |
1. Data Preparation |
|
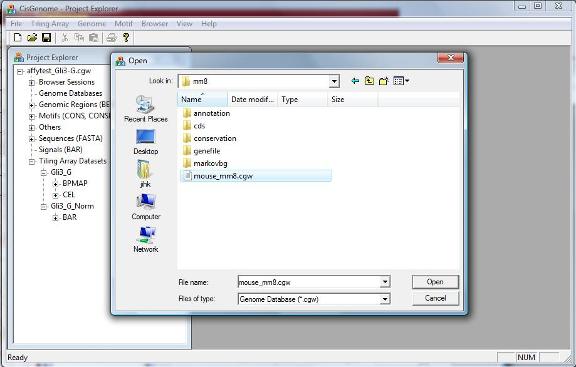
A dialog will jump out to ask you select a genome database. Go to the folder where you installed/unzipped your database. Within the database folder, you should be able to find a file with a “.cgw” suffix. Usually this file is named as “[species]_[version].cgw”, e.g., mouse_mm8.cgw. Choose this file, and click “Open” button. |
|
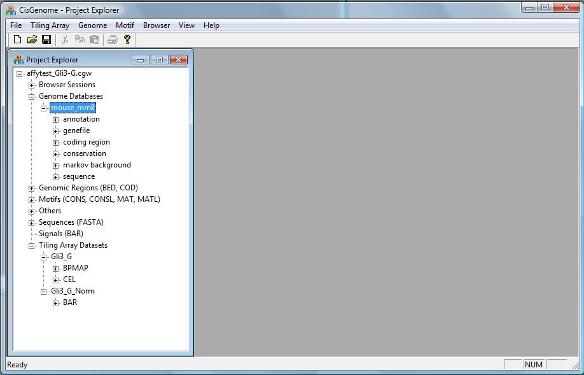
If the database is loaded correctly, you should now see a new item in the Project Explorer Window, under “Genome Databases” (as shown below). |
2. Create a ChIP-seq Analysis Project |
|
When you start the CisGenome GUI, it will automatically open an empty data analysis project. Before you can analyze ChIP-seq data, you need to load both the genome database and the alignment files into the project.
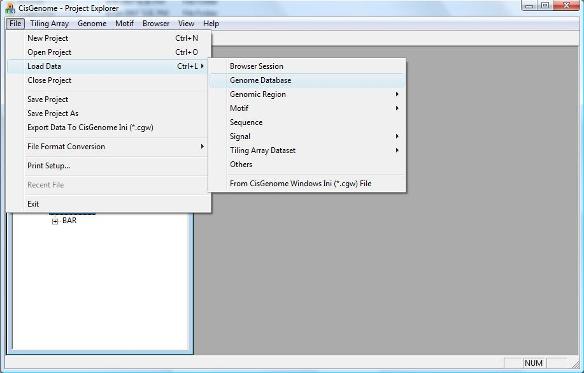
2.1 Loading Genome Database To load a genome database, in the menu system click “ File > Load Data > Genome Database” . |
|
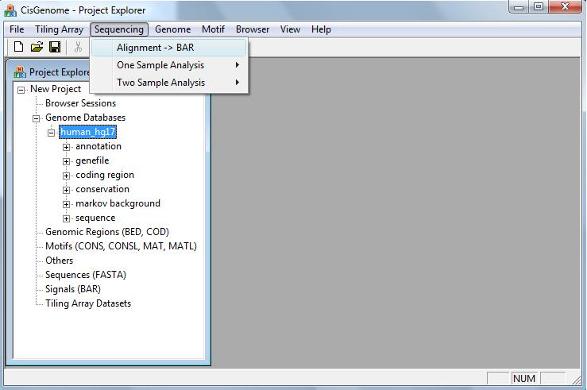
2.2 Loading Alignment Files To load the alignment files, click the menu “ Sequencing > Alignment->BAR” |
|
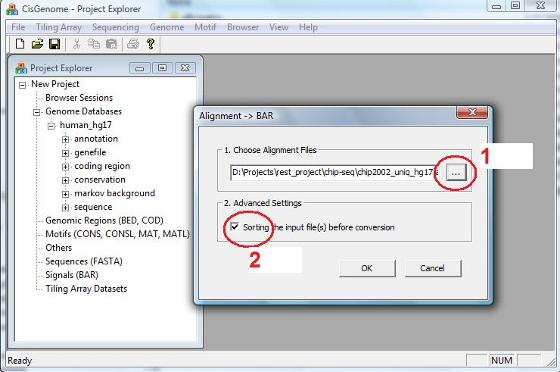
A dialog will jump out. In the dialog, first click the button highlighted by the red circle 1. A “Open” file dialog will appear to allow you choose one or more alignment files from your computer. If the alignments in the files haven’t been sorted using genomic coordinates, you should check “Sorting the input file(s) before conversion” (red circle 2). Otherwise, uncheck the box to save some computational time.
After you’ve done, click the “OK” button, and the program will start to run. |
|
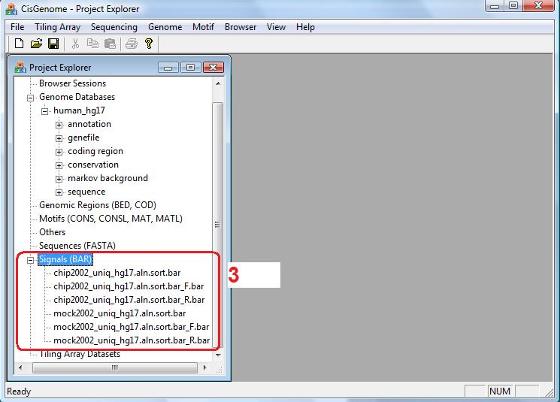
When the run finishes, you will be able to see a list of newly generated *.bar files in the “Project Explorer” window, under the “Signals (BAR)” section (red circle 3). These BAR files are converted from your input text files. Although the BAR files and the input text files contain the same alignment information, the BAR files are coded in a binary format and can greatly improve the performance of visualization and downstream computation. The BAR files will be used as input for all the downstream analyses. |
|
Since you have already created a ChIP-seq analysis project, you can start to analyze the data. However, before we do that, you need to know two important techniques, i.e. how to save your project and how to open a project. They are important because you can then save your project at any time, and next time you want to revisit your project, you don’t need to repeat all the analyses you’ve already done.
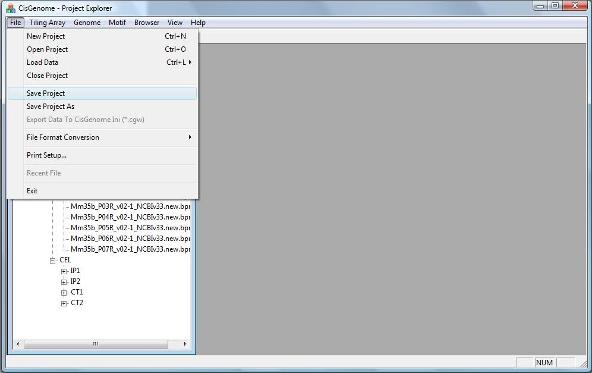
To save you current project, click menu “File > Save Project”. A dialog will show up to help you save your project to a CisGenome Windows Project (*.cgw, or CGW) file. |
|
After you saved your project, you can try to close your project by clicking “File > Close Project”.
You can then try to reload your project by choosing the menu “File > Open Project”. Once again, a dialog will jump out and ask you to choose a CGW file to open. After you open the file, you will be able to see all the data in the project in the CisGenome Project Explorer Window.
Remember to save your project frequently to avoid loss of your analysis efforts.
Now, we are ready to search for peaks in the data. We will start from the easiest one sample analysis case in which only a single ChIP sample is available, and we want to find binding regions from the reads sequenced for this single sample. Next> |
3. Save Your Project |